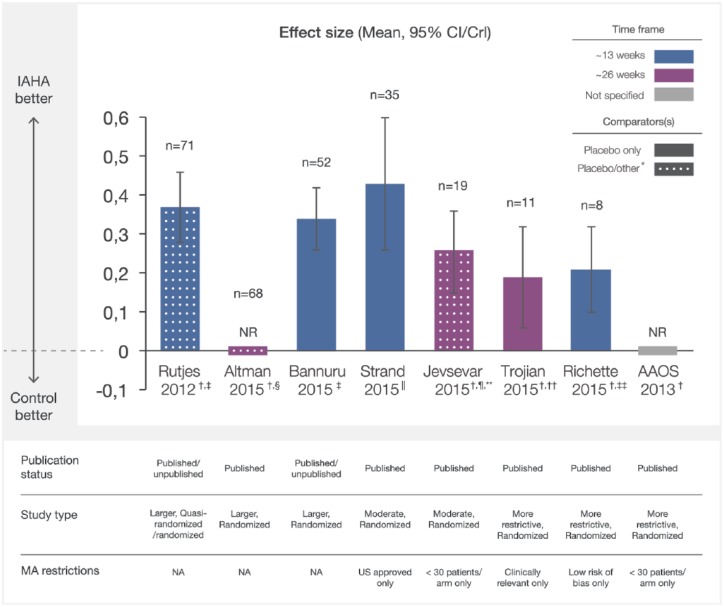
Figure 2.
Overall pain effect sizes of IAHA therapy compared with IA placebo from recent meta-analyses. Effect sizes reported from recent MAs were plotted with CI/CrI intervals. Assessment time frames for each study are indicated. Solid bars indicate comparison of IAHA with placebo only and mottled bars indicate comparison with placebo and other interventions. CI/CrI ranges above zero indicate statistically significant outcomes.
CI, confidence interval; CrI, credible interval; IAHA, intra-articular hyaluronic acid; MA, meta-analysis; n, number of trials included in MA; NA, not applicable; NR, not reported
*other defined as nonintervention control, usual care, or IAHA added to another active treatment
† effect sizes reported as negative values at source, transformed to positive values for comparison with other studies
‡ examined outcomes at a timepoint nearest to 13 weeks
§ examined outcomes at a timepoint nearest to 26 weeks
|| reported outcomes between 4 and 13 weeks
¶ comparator was placebo (n = 14) or usual care (n = 2), or alternatively, IAHA added to an active treatment (n = 3) ~ 13 weeks
** most common endpoint at 26 weeks,
†† the time of best response over 8–26 weeks
‡‡ at 13 weeks follow up.

