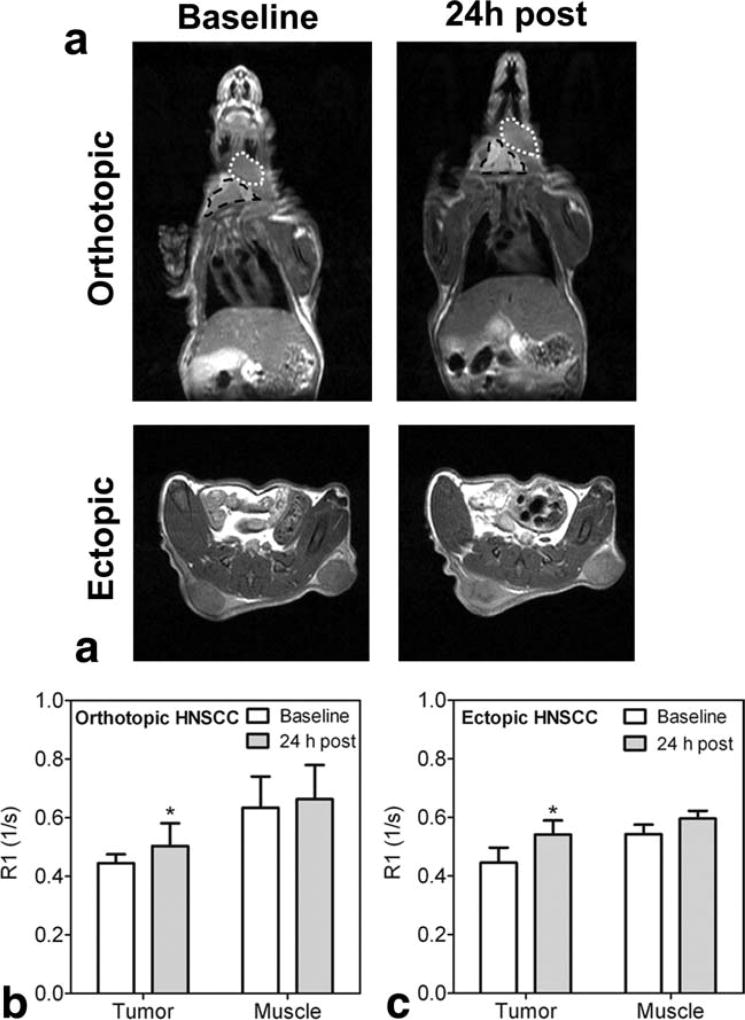
FIG. 4.
ME-MRI of ectopic and orthotopic HNSCC xenografts. Coronal and axial T1-weighted images of tumor-bearing mice (a). Anatomic extent of tumor (white dotted line) and salivary gland (black outline) are shown in the upper panel of images. R1 values of whole tumor regions of interest and murine muscle tissue at baseline and 24 h after MnCl2 are also shown for orthotopic (b) and ectopic tumors (c). Data are reported as mean ± standard deviation. *P < 0.05.

