
Fig 1. Binding of monoclonal antibody standards to cognate-epitope control features.
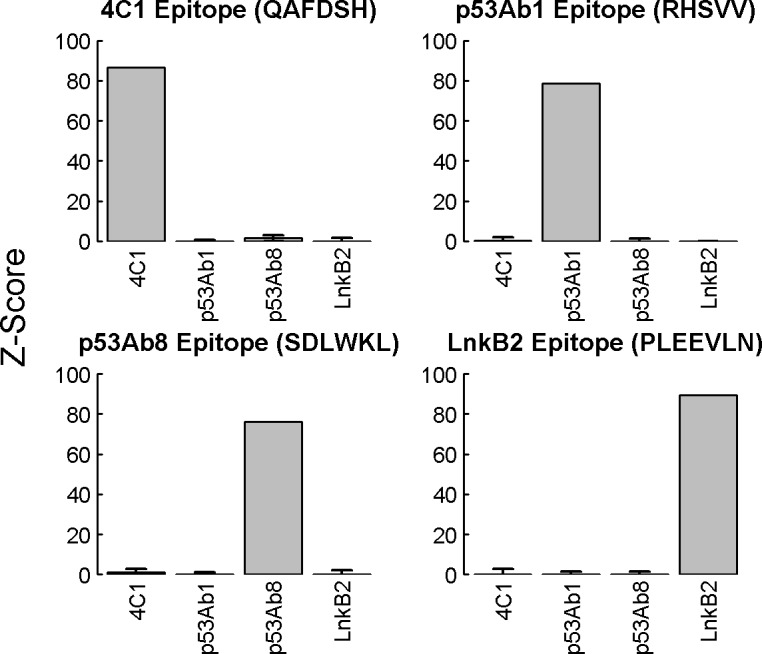
Four well-characterized mAbs (4C1, p53Ab1, p53Ab8 and LnkB2) were separately applied to arrays at 2.0 nM with competitor, in triplicate, and then detected with an anti-mouse secondary reagent. For each binding assay the mean log10 relative fluorescent intensity (RFI) of the epitope control features were used to calculate a Z-score. The results corresponding to each epitope were plotted as separate bar graphs, with the mAb recognition sequences shown above the graphs. The mAb clones are indicated as bars along the x axes within each graph. Error bars represent the standard deviation of the individual control feature Z-scores. Cognate controls were saturated, leaving a standard deviation of zero on the Z scores for these feature replicates.