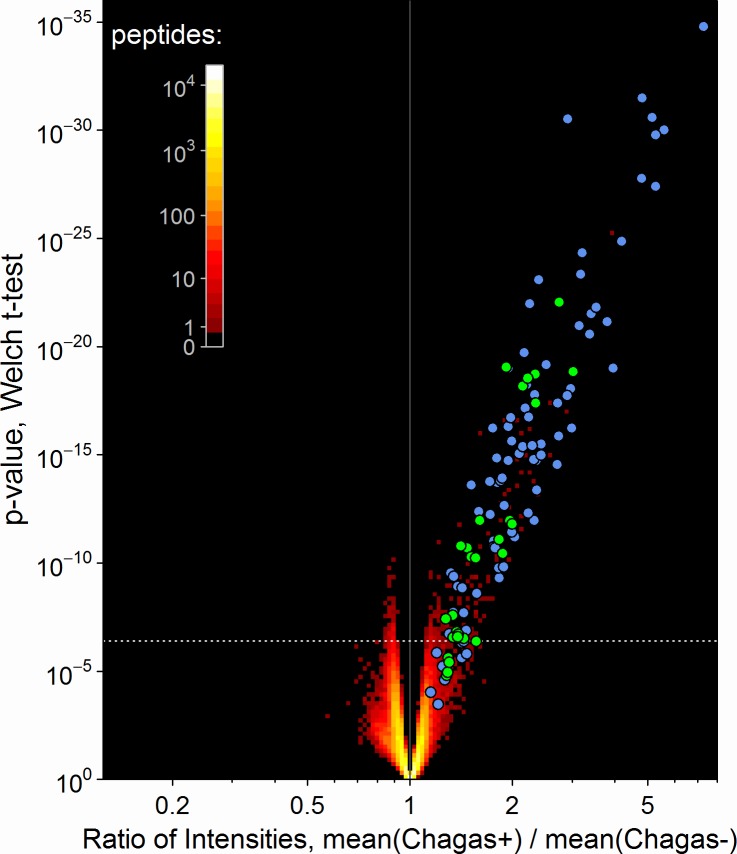
Fig 2. A set of library peptides reproducibly displayed antibody-binding signals that were significantly different between Chagas seropositive and seronegative donors.
A volcano plot is used to assess this discrimination as the joint distribution of t-test p-values versus the ratio of geometric mean intensities for Chagas positive donors relative to Chagas negative. The density of peptides at each plotted position is indicated by the color scale. The 356 peptides above the dashed white line discriminate between positive and negative Chagas sero-status by IST with 95% confidence after applying a Bonferroni adjustment for multiplicity. The colored circles indicate individual peptides with intensities that were significantly correlated to the T. cruzi ELISA-derived S/CO value either by a Bonferroni threshold of p < 4e-7 (green) or the less stringent false discovery rate (FDR) of <10% (blue).

