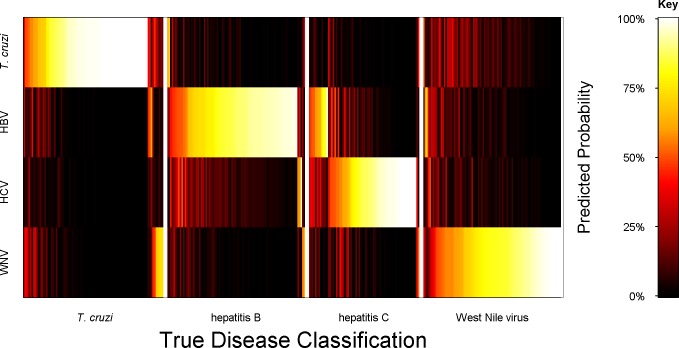
Fig 7. Probabilities of T. cruzi, hepatitis B, hepatitis C and West Nile virus class assignments.
Mean probability assignments for each sample to each of the four disease classes were calculated by out-of-bag predictions from four-fold cross-validation analyses using a multiclass SVM machine classifier. The cross-validations were permutated and retested 100 times. Each sample had a predicted membership for each disease class that was given a color ranging from 0 (black) to 100% (white), corresponding to probabilities from 0% to 100%. A matrix arrangement was used to visualize all combinations of true (x axis) versus predicted (y axis) assignments.

