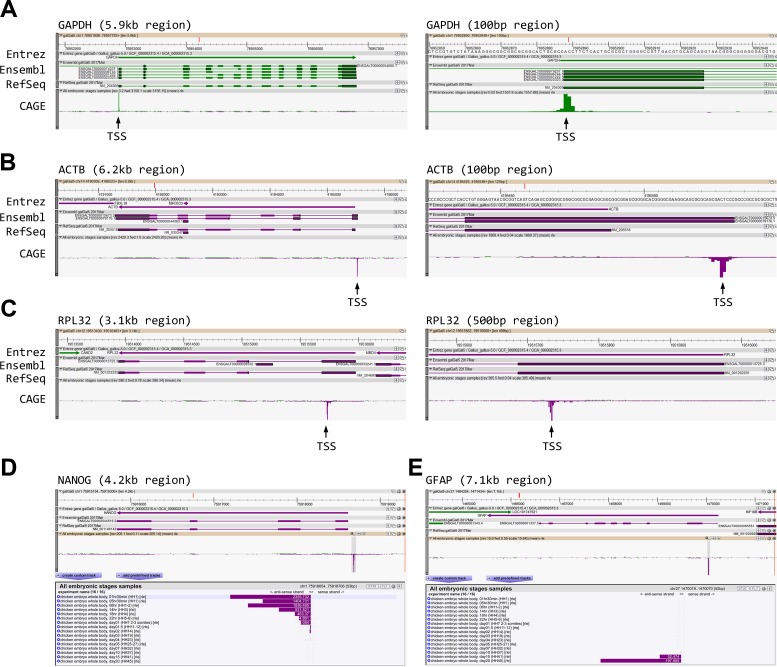
Fig 2. Chicken-ZENBU views of transcription start site (TSS) peaks and expression levels.
(A) A robust single TSS peak (arrow) is correctly mapped to the known Ensembl and RefSeq 5′ end of GAPDH. Right panel: zoomed-in view of left panel. (B) Ambiguity in ACTB gene annotation can be resolved using Cap Analysis of Gene Expression (CAGE). (C) The TSS representative of RPL32 gene does not confirm either available annotation, suggesting the incorrectness of both gene models. (D) Bar graph of expression values shows NANOG pluripotency gene present at early stages, then down-regulated at later stages. (E) Late stage–specific expression of GFAP gene (Hamburger and Hamilton stage 41 [HH41] and HH45). Samples in the bar graphs are sorted by developmental stage.

