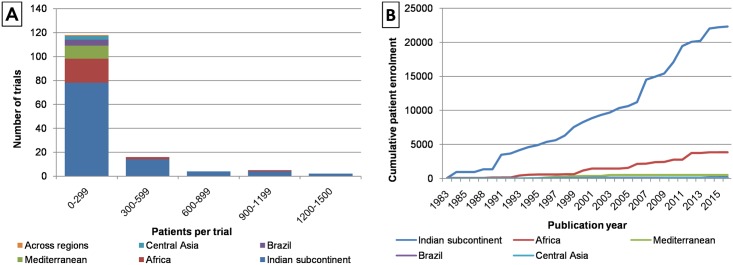
Fig 2. Size, location and date of visceral leishmaniasis clinical trials.
A: The histogram shows the size distribution of visceral leishmaniasis clinical trials. Bars are coloured according to the region in which the trials were conducted. B: The cumulative enrolment of patients into clinical trials is shown as a function of the year in which the trial results were published. Data are divided according to the location at which the patients were enrolled.

