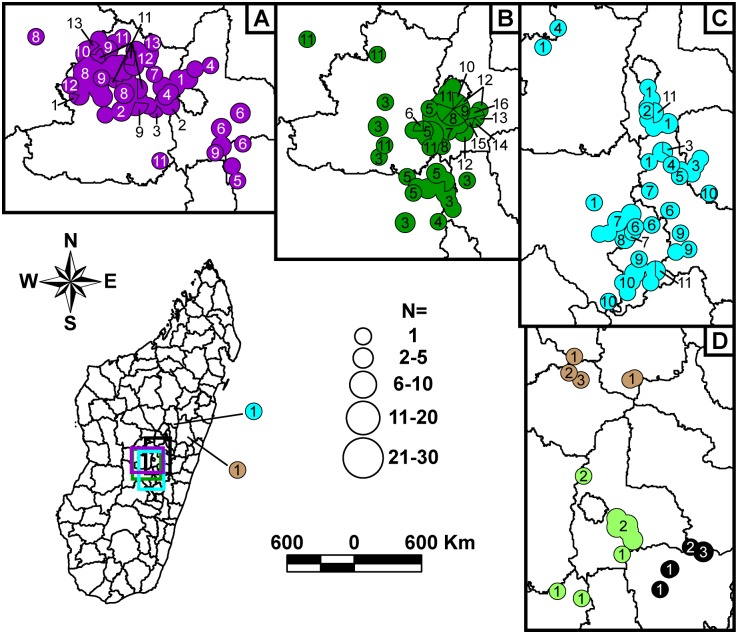
Fig 6. Geographic distributions of identified SNP nodes within Group II.
Four map panels showing the geographic distributions of identified SNP nodes within Group II phylogenetic subgroups v (A), h (B), t (C), and u, w, and x (D) are presented, with symbols and colors as in Fig 5. A full map of Madagascar indicates the portion of Madagascar included in each of the expanded map panels, with each expanded section indicated by a colored rectangle corresponding to the color associated with one of the phylogenetic subgroups depicted in the corresponding expanded panel.

