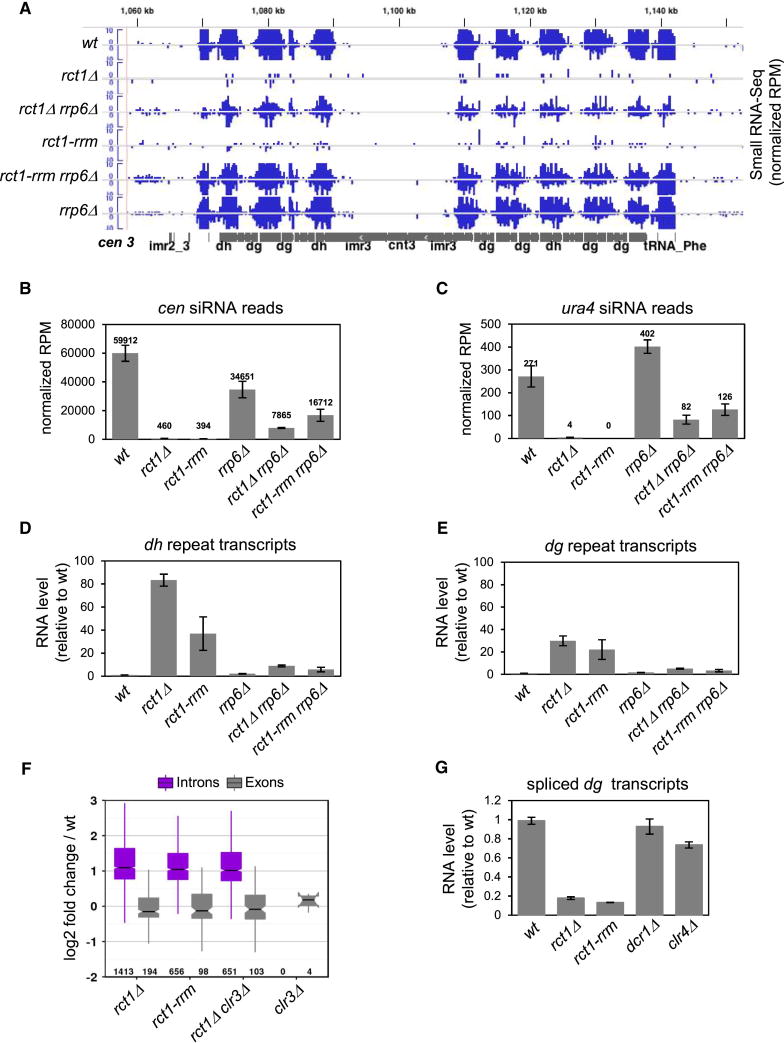
Figure 4. Rct1 Mediates Splicing and Prevents Targeting by the Exosome, See also Figures S3C, S3D and S4.
(A) cen siRNA levels and distribution in indicated strains. Small RNA-seq tracks (blue), cen 3 (grey). Y-axis represents normalized reads in each library (RPM).
(B) Quantification of cen siRNAs in indicated strains. Y-axis represents normalized reads in each library (RPM). Data from two biological replicates of each strain were analyzed with the exception of rct1-rrm mutant cells, where data from one strain was analyzed. Error bars indicate SEM.
(C) Quantitative analysis of ura4 siRNA levels in indicated strains as described in (B).
(D and E) RT-qPCR analysis of dh/dg transcript expression levels in mutant strains as indicated. actin transcript levels were used for normalization by ΔΔCT method. Y-axis represents RNA expression levels relative to wild type. Two biological replicates were used for each genotype and qPCR reactions were performed in triplicates for each strain. Error bars indicate SEM.
(F) Log2 fold changes are shown for all differentially expressed intron (purple) and exon (grey) observations in independent comparisons of mutant and wild type RNA-seq as determined by DEXSeq with false discovery rate < 0.05. Number indicates differentially expressed inton/exon number in each strain. Boxes represent the interquartile range bisected by the median. Whiskers extend to the lesser of IQR × 1.5 or the most extreme observation.
(G) RT-qPCR analysis of spliced dg transcript levels in mutant strains using primers complementary to exon splice junctions of the dg non-coding centromeric transcripts. Total dg transcript levels were used for normalization by ΔΔCT method. Y-axis represents spliced RNA expression levels relative to wild type. At least two biological replicates were used for each genotype and qPCR reaction was performed at least twice for each strain. Error bars indicate SEM. Note that overall dg transcript levels were much higher in mutant than in wild type cells (Figure 3).

