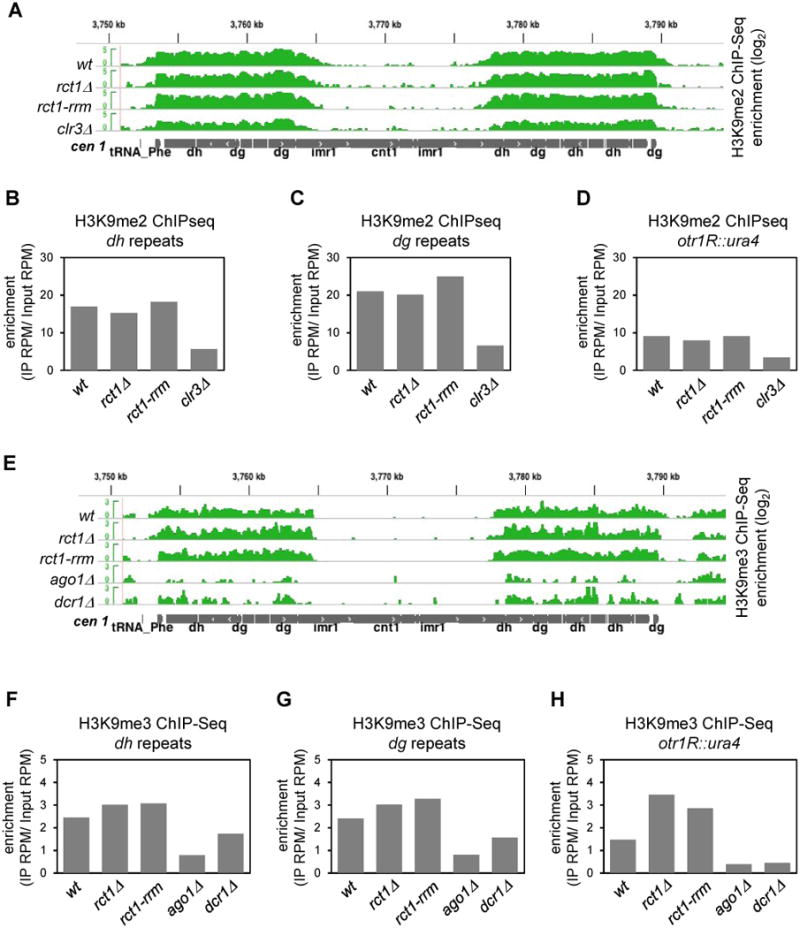
Figure 6. Rct1 Is Not Required for H3K9 Methylation at Pericentromeric Heterochromatin, See also Figure S6.

(A) H3K9me2 enrichment and distribution in indicated strains. ChIP-seq tracks (green), cen 1 (grey). Y-axis represents the log scale of enrichment. Positive value indicates enrichment after IP as compared to input controls, only positive values were shown.
(B, C and D) Quantification of H3K9me2 enrichment in indicated strains at endogenous dh/dg repeats (B) (C) and otr1R::ura4 transgene region (D).
(E) H3K9me3 enrichment and distribution in indicated strains. ChIP-seq tracks (green). cen 1 (grey). Y-axis represents the log scale of enrichment. Positive value indicates enrichment after IP as compared to input controls, only positive values were shown.
(F, G and H) Quantification of H3K9me3 enrichment was performed as in (B, C and D). Data from two biological replicates of rct1Δ mutant cells were analyzed.
