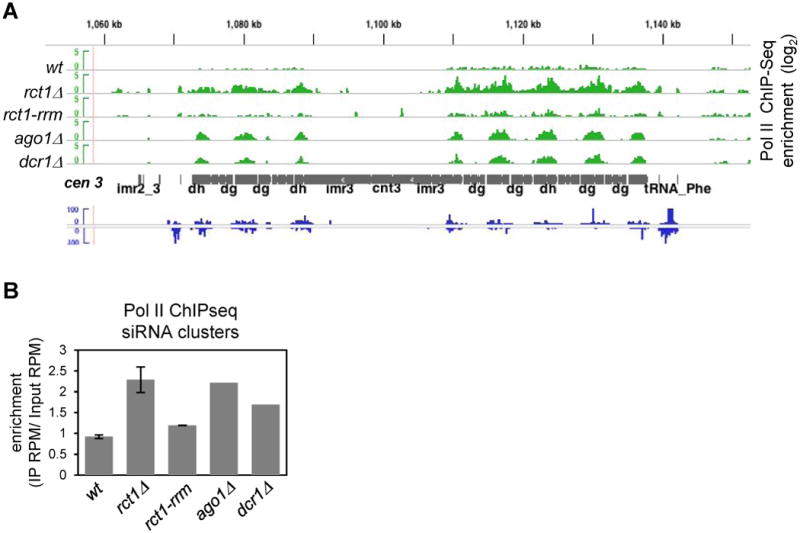
Figure 7. Rct1 Releases Pol II from siRNA Cluster Regions Independently of the RRM, See also Figure S7.

(A) Pol II enrichment and distribution in indicated strains. ChIP-seq tracks (green), cen 3 (grey), wild type cell small RNA-seq tracks, (blue). Y-axis represents the log scale of enrichment. Positive value indicates enrichment after IP as compared to input controls, only positive values were shown.
(B) Quantification of Pol II enrichment within siRNA clusters in indicated strains. siRNA cluster regions were defined by > 100 siRNA counts on genome browser tracks. Data from two biological replicates of rct1Δ mutant cells were analyzed. Two independent ChIP experiments were performed and libraries were constructed independently, with the exception of ago1Δ and dcr1Δ mutants, where one ChIP experiment was done. Error bar indicates SEM.
