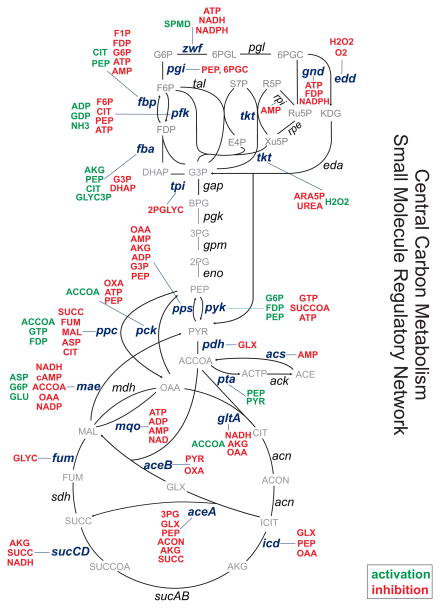
Figure 3. Small Molecule Regulatory Network of E. coli Central Carbon Metabolism.
Depiction of the small molecule regulatory interactions in the central carbon metabolism of E. coli. Red metabolites are inhibitors, green metabolites are activators of the indicated reactions. Another view of this SMRN is given in Figure S3, showing clearly which reactions are inhibited, activated, or both.

