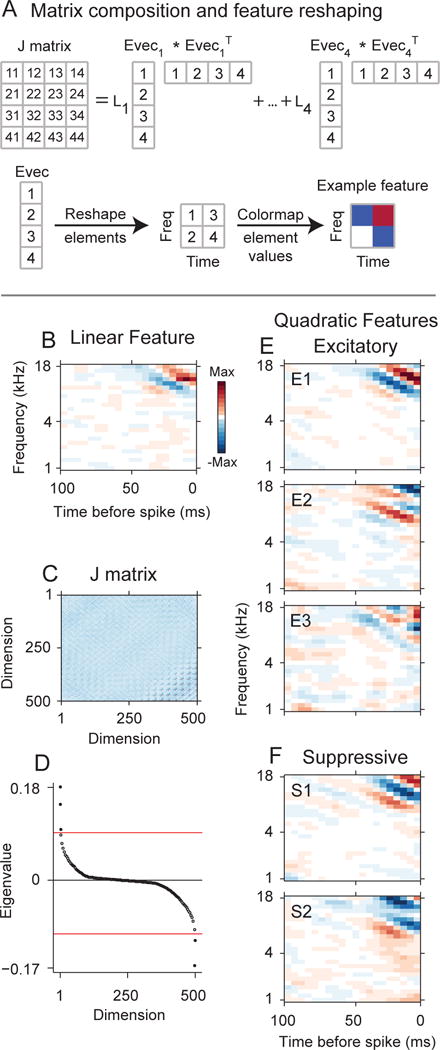
Figure 1.

MNE model of a primary auditory cortical (AI) neuron. The model accounts for the linear and quadratic stimulus statistics that account for the response (analogous to the spike-triggered average (STA) and spike-triggered covariance (STC) distributions, respectively). (A) Simplified cartoon showing the composition of the J matrix, which contains the quadratic stimulus interaction that account for the response. In this simplified case sound stimulus spectrograms have 2 frequencies and 2 time bins. (A,Top) The J matrix may be decomposed into a set of eigenvalues (L1, …,L4) and corresponding eigenvectors (Evec1, …, Evec4). Numerals in the matrix and vectors indicate element numbers. Values in J indicate row/column pairs. Example: 32 represents the element at row 3, column 2 in J. (A,Bottom) Each eigenvector may be reshaped into a spectrotemporal stimulus feature. In this simplified example the eigenvector has four elements and is reshaped into a 2×2 matrix. The matrix values are color-mapped to display spectrotemporal structure. (B–F) MNE model for a primary auditory cortical neuron. (B) The linear feature has subfields oriented in frequency and time. (C) The J matrix was decomposed, and (D) five significant eigenvalues (p < 0.01, randomization test, red-line) were found, resulting in five spectrotemporal features that account for the neuron’s response. (E) Three excitatory spectrotemporal features (increase neural responsiveness). E1: most significant excitatory feature, E2: second-most significant feature, etc. (E) Two suppressive spectrotemporal features (decrease neural responsiveness).
