
Figure 4. Restricted normal tissue expression of GPC2 and alternative GPC2 transcript expression.
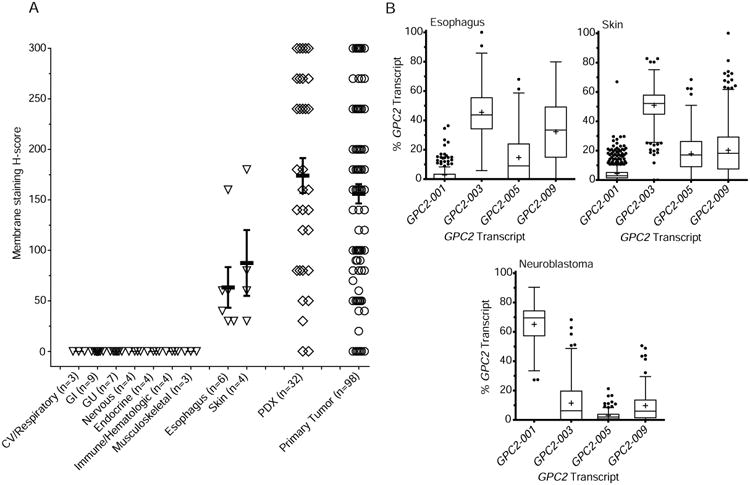
(A) Summary of GPC2 membrane staining H-scores from a pediatric normal tissue array (total n = 36 unique normal tissues, n of each organ system or individual tissue indicated on X-axis). Summary of GPC2 membrane H-scores from neuroblastoma primary tumors/PDXs shown for comparison.
(B) RNA transcript specific analysis of GPC2 expression in primary neuroblastomas and the low-level GPC2 expressing normal tissues skin and esophagus (n = 126 high-risk neuroblastomas, TARGET; n = 201 esophagus samples and 684 skin samples, GTEx).
Data in A represent means ± SEM. Box plots in B extend from the first to the third-quartile, the horizontal line is the median, “+” represents the mean and the error bars represent the 1.5 interquartile range from the first-and third-quartile.
CV, cardiovascular; GI, gastrointestinal; GU, genitourinary.
See also Figure S4; Table S2.