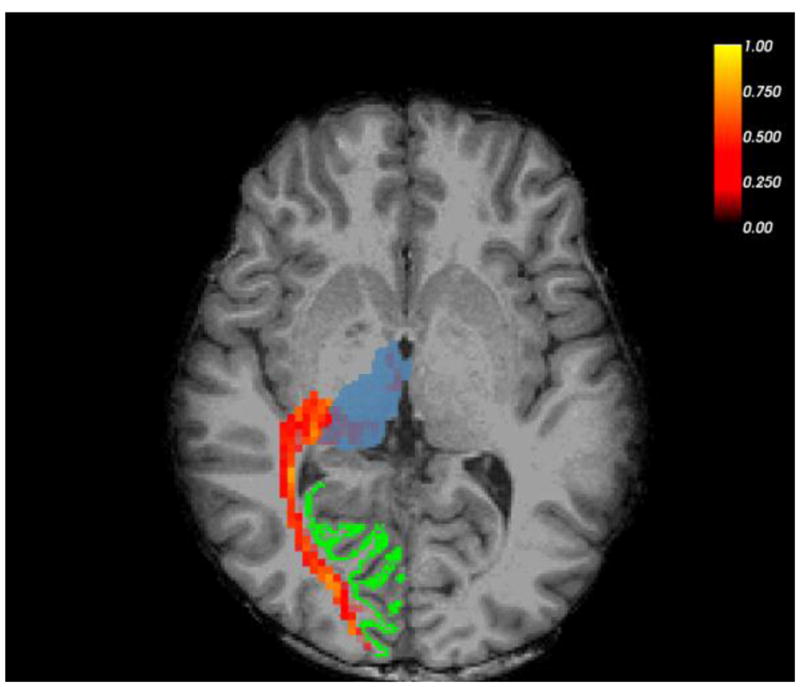
Figure 1.

Example right-hemisphere optic radiation tract and seed masks in a healthy control participant, overlaid on that participant’s high-resolution anatomical scan (T1). Thalamus mask is in blue, V1 mask in green. Thresholded FA map is in red/yellow; brighter colors indicate higher FA.
