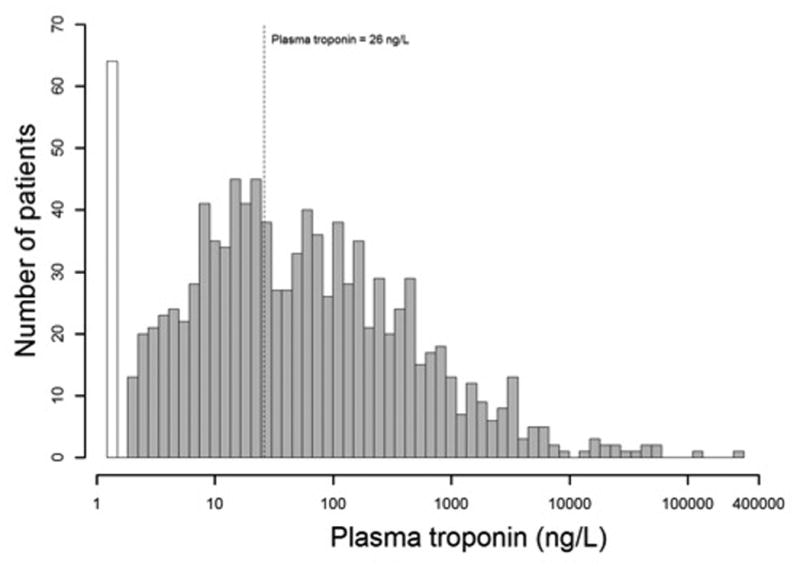
Figure 1.

Distribution of high sensitivity troponin I levels in study population.The white bar represents 6% of the cohort with no detectable high sensitivity troponin I levels at the day of intubation (day 0, baseline). The dotted line represents a high sensitivity troponin I level of 26 ng/L, corresponding to the 99th percentile reference value of a healthy population.
