
Fig.6.
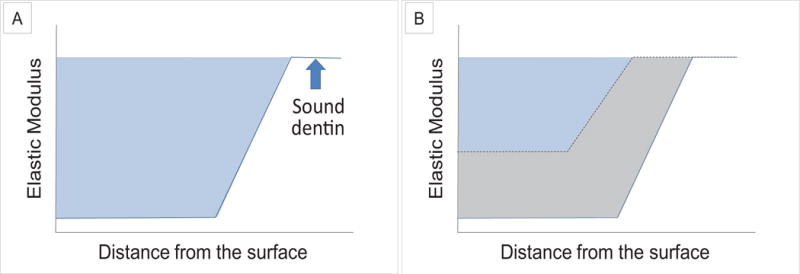
A measure of the lost mechanical properties from the reduced elastic modulus (Er) vs. distance curves after demineralization with an upper boundary provided by the value of sound dentin (light blue region; A). This represented the Recovery Goal that was sought for remineralization. The Recovery Gained was defined as the area between the demineralization curve (blue line) and the Er curve (black dotted line) after remineralization (gray region; B). Recovery (%) was ratio of the Gain/Goal × 100.