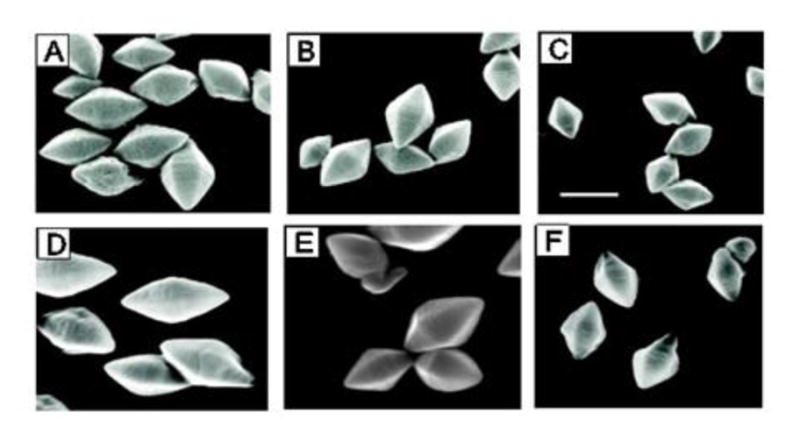
Fig. 4.

Scanning electron micrographs of Cyt1Aa crystals produced using the four different promoter constructs. A. Crystals produced using the 511 bp upstream sequence that contains all three promoters (BtI, BtII and BtIII; 4Q7/pSF123); B. Crystals produced using the 247 bp upstream sequence that contains only BtII and BtIII (4Q7/pSF23); C. Crystals produced using the 116 bp upstream sequence that contains only BtIII (4Q7/pSF3); D. Crystals produced using the 420 bp upstream sequence that contains only BtI and BtII (4Q7/pSF12); E. Crystals produced using the 286 bp upstream sequence that contains only BtI (4Q7/pSF1); F. Crystals produced using the 151 bp upstream sequence that contains only BtII (4Q7/pSF2). A bar indicates 1 μm and all micrographs are of the same magnification.
