Figure 6.

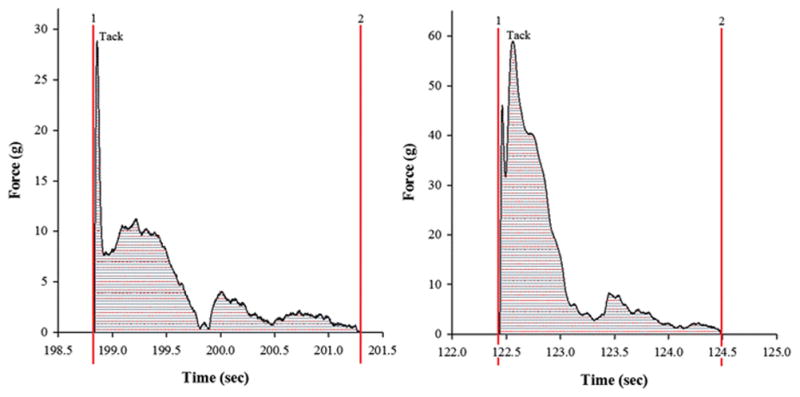
Force vs. Distance profile for (A) F1 and (B) F2 (The figures have been enlarged to depict the area under the curve which represents the work of adhesion). Each value represents the mean ± S.D. (n=3).

Force vs. Distance profile for (A) F1 and (B) F2 (The figures have been enlarged to depict the area under the curve which represents the work of adhesion). Each value represents the mean ± S.D. (n=3).