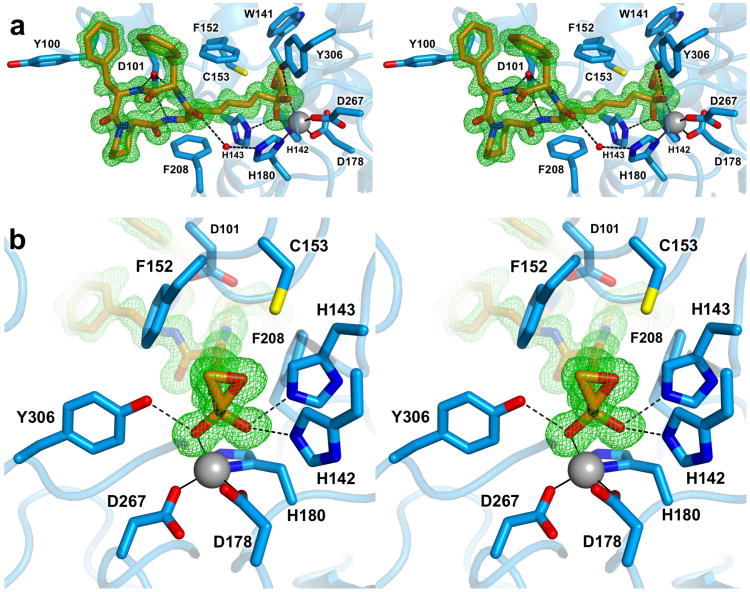
Figure 2.

1.24 Å-resolution structure of the HDAC8–trapoxin A complex. (a) Stereoview of trapoxin A (C = orange, N = blue, O = red) bound in the active site of HDAC8 (C = light blue, N = blue, O = red). The simulated annealing omit map of trapoxin A (green) is contoured at 3.0σ. Metal coordination and hydrogen bond interactions are indicated by solid and dashed black lines, respectively. (b) Close-up stereoview showing the zinc-bound gem-diolate. Atomic color coding is identical to that in (a).
