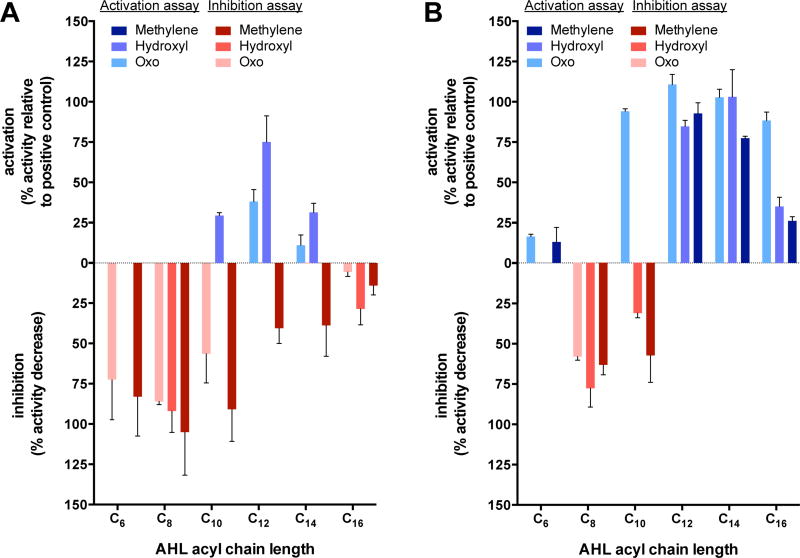
Fig. 2.
Comparative activation and inhibition data for AbaR (A) and LasR (B) by aliphatic AHLs. Activation is reported in blue shades on the positive y-axis as the % activity relative to that induced by the receptor’s native ligand (2 for AbaR and 1 for LasR). Inhibition activity is reported in red shades on the negative y-axis as the % decrease in activity relative to only native ligand being present. When both activation and inhibitory activity were observed, only the activity with the highest percent value is displayed for clarity. Activities of 3-methylene AHLs 5–10 displayed with dark shades, activities of 3-hydroxyl AHLs 11–15 displayed with medium shades, and activities of fully oxidized 3-oxo AHLs 16–18, 1, 19, and 20 displayed with light shades. Error bars represent s.e.m. of a biological triplicate. See Table S3 legend and Supplemental Methods for assay details.

