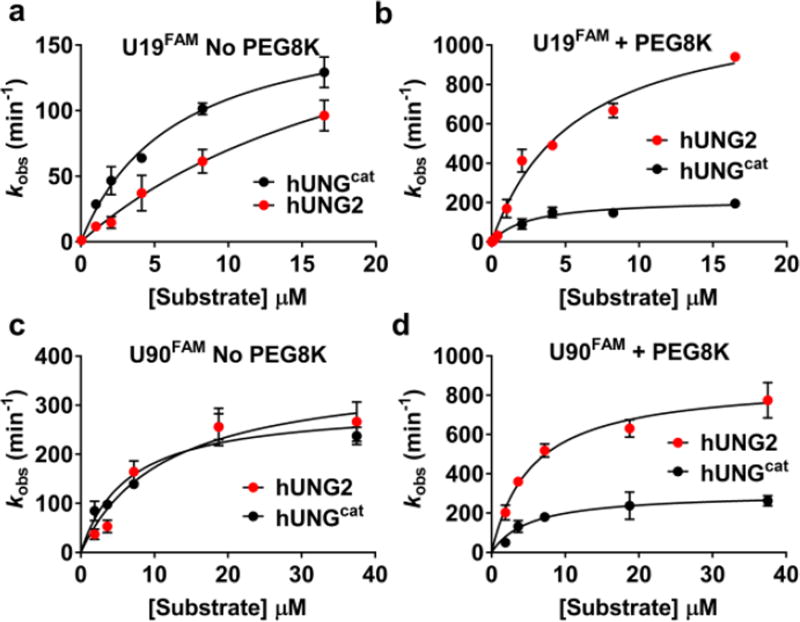
Figure 2.
Contribution of the N–terminal extension of hUNG2 to steady–state turnover in the absence and presence of 20% PEG8K. (a) Substrate concentration vs velocity plots for hUNG2 and hUNGcat using U19FAM DNA in the absence of 20% PEG8K. (b) Substrate concentration vs velocity plots for hUNG2 and hUNGcat using U19FAM in the presence of 20% PEG8K. (c) [Substrate] vs velocity plot using U90FAM DNA in the absence of PEG8K, and (d) in the presence of 20% PEG8K. All rate measurements were performed in triplicate and the mean and standard deviations are indicated.

