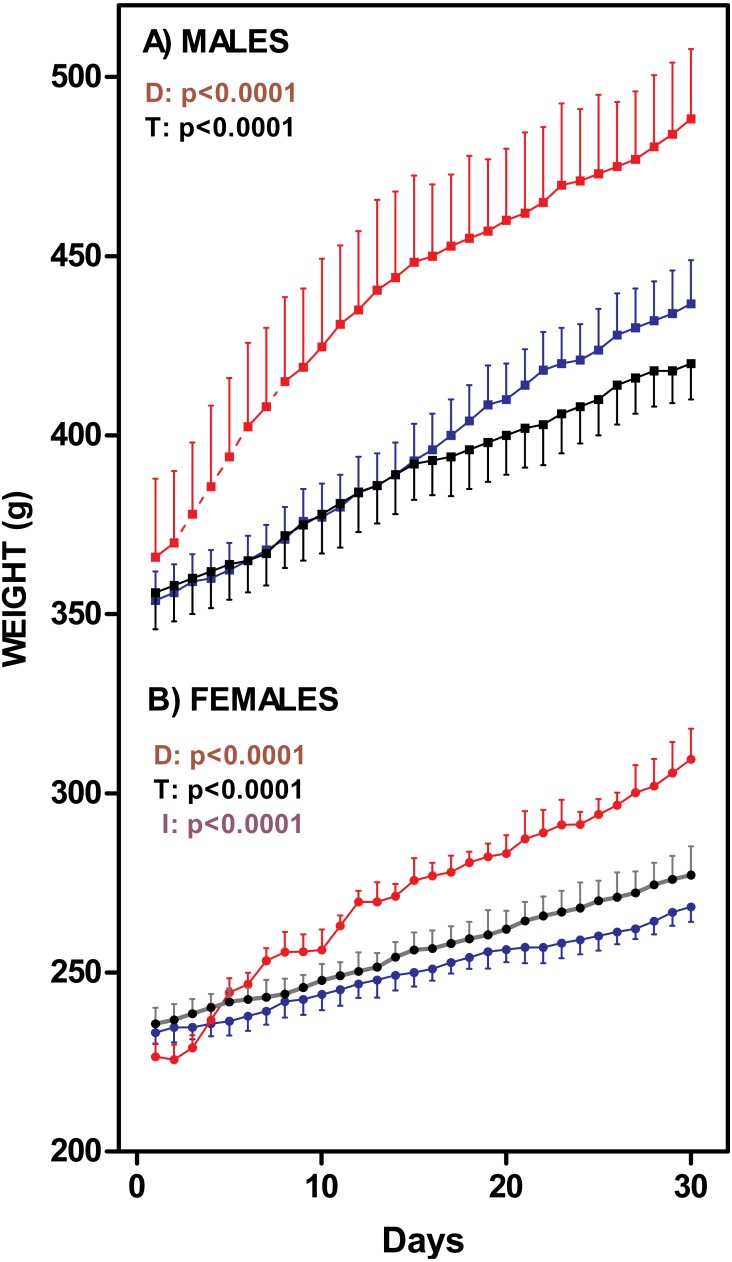
Figure 1. Rat weight changes through 30-days of dietary treatment.
(A) represent males (squares) and (B) represent females (circles). Data are expressed as mean ± SEM of six to eight animals per group. Black: rats fed standard diet (C); Blue: rats treated with standard diet supplemented with fat (HF); Red: rats fed cafeteria diet (K). Statistical comparison were established by two-way ANOVA (T, time; D, diet; I, their interaction) and the Bonferroni post-hoc test (p < 0.05).

