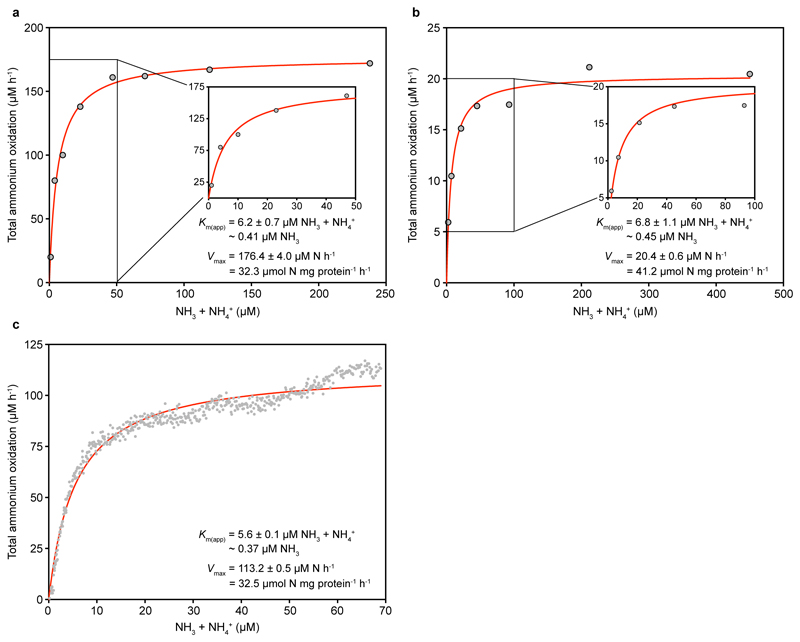
Extended Data Figure 7. Ammonia oxidation kinetics of N. viennensis.
Apparent half-saturation constants (Km(app)) and maximum oxidation rates (Vmax) for total ammonium were determined by fitting the data to the Michaelis-Menten kinetic equation. The red curve indicates the best fit of the data. Standard errors of the estimates based on non-linear regression are reported. See Methods for details of experiments and calculations. a, b, Total ammonium oxidation rates were calculated from microsensor measurements of NH3 dependent O2 consumption and discrete slopes over many substrate concentrations. Results for two biological replicates are shown here; a third biological replicate is shown in Fig. 1c. c, Total ammonium oxidation rates were calculated from microsensor measurements of NH3 dependent O2 consumption in a single trace measurement.

