
Figure 11.
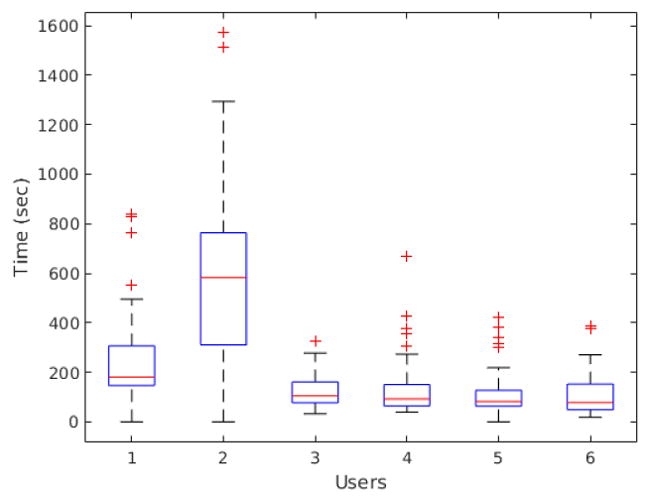
Counting time distribution per user in seconds. User #1, #2 and #3 counted the original images, while user #4, #5 and #6 counted the images with detected cells highlighted
Official websites use .gov
A
.gov website belongs to an official
government organization in the United States.
Secure .gov websites use HTTPS
A lock (
) or https:// means you've safely
connected to the .gov website. Share sensitive
information only on official, secure websites.
Counting time distribution per user in seconds. User #1, #2 and #3 counted the original images, while user #4, #5 and #6 counted the images with detected cells highlighted