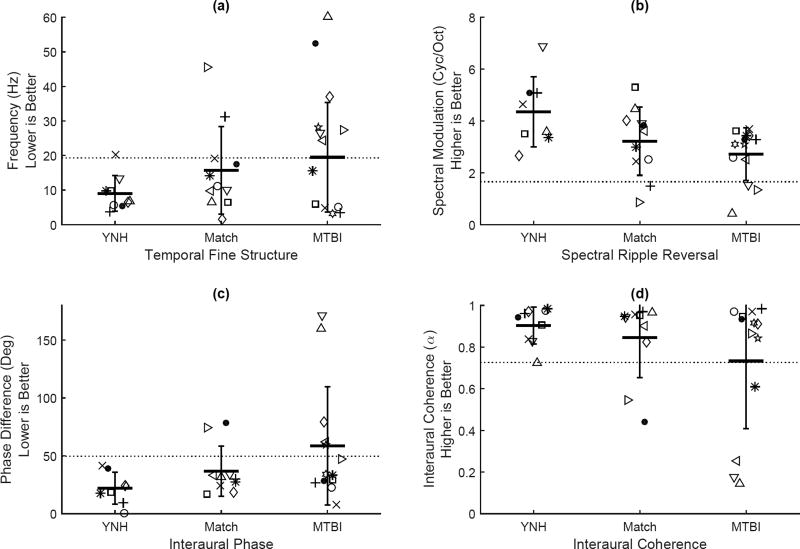
Figure 4.
Individual results of the four psychoacoustic tests for each group. Listeners are represented by a different symbol in each group and the symbols correspond to those used in Table 1. Group mean and SD are shown with horizontal bars. Horizontal dashed line represents normal limits as defined by 2 SD worse than YNH mean thresholds.

