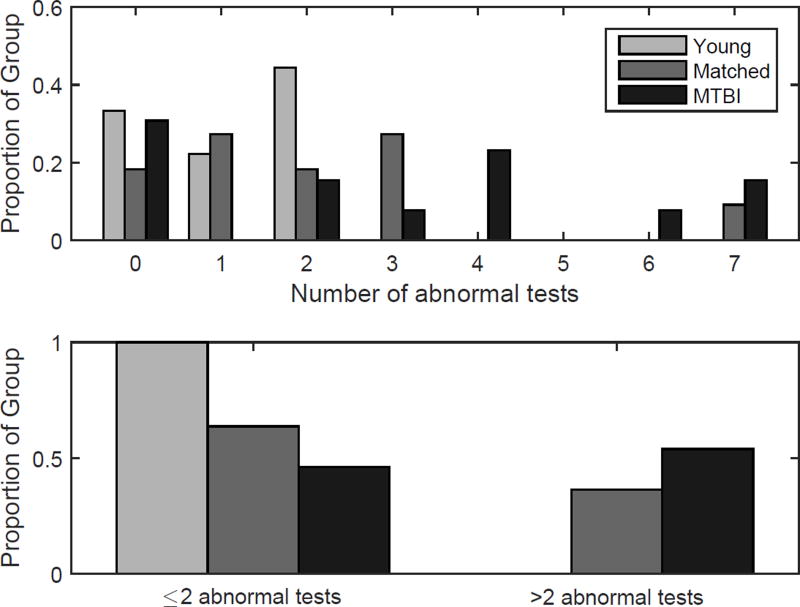
Figure 5.
The proportion of listeners who performed in the abnormal range for a given number of tests. Abnormal was defined by clinical normative data for the QuickSIN and WIN tests, and two SD worse than the YNH mean for all other tests. The top panel shows the proportion of listeners in integer bins, and the lower panel shows the proportion who had abnormal results on two or fewer tests versus more than two tests. Groups are separated by lightness, with the young group represented by the light grey bars, the matched group in medium grey bars, and the MTBI group in dark grey bars. Note that none of the listeners in the YNH group were abnormal on greater than two tests.

