


Figure 2. c-MET is overexpressed and activated in VEGFR TKI-resistant NSCLC murine models.
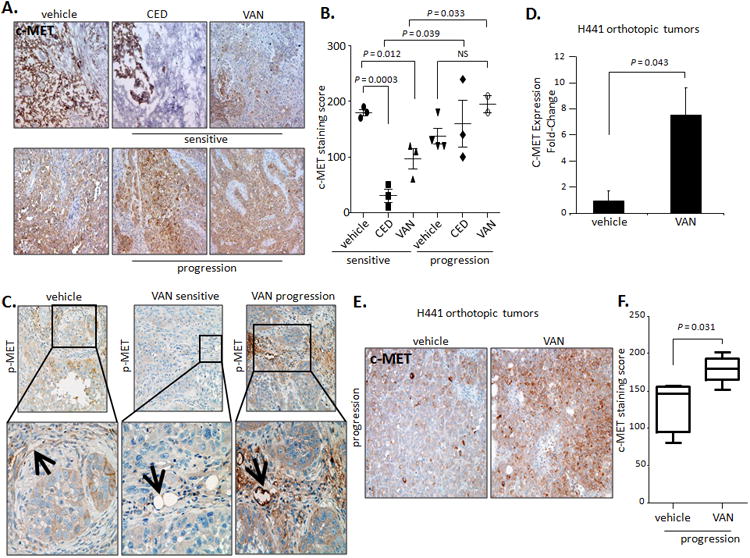
A. Representative IHC staining (×200) and B. Quantification of total c-MET in H1975 tumors treated with vehicle, CED, or VAN. Data graphed as mean score (overall intensity) ± SEM. C. Representative IHC images (×200 top; ×400 bottom) for phosphorylated c-MET (p-MET) in H1975 tumors treated with vehicle (n=3), VAN for 14 days (n=3), or until progression (n=2). At least 3 photomicrographs were collected per sample. Data graphed as mean score ± SEM. P values are from t test. The black arrows indicate the localization of positive p-MET staining on tumor-associated endothelium. D. Quantitative reverse-transcriptase PCR shows human c-MET mRNA expression levels in H441 orthotopic tumors treated with vehicle or VAN until progression (n=4/group). Data are normalized relative to mRNA levels in vehicle-treated samples and graphed as mRNA relative levels ± SEM. P values are from t test. E. Representative IHC staining (×100) for c-MET in H441 orthotopic tumors treated with vehicle or VAN until progression (≥5 photomicrographs/sample, n=4-5/group). F. Quantification of the c-MET immunostaining in H441 tumors treated with vehicle or VAN until progression (≥3 core fields/sample quantified). Data shown as mean score ± SEM. P values are from t test.