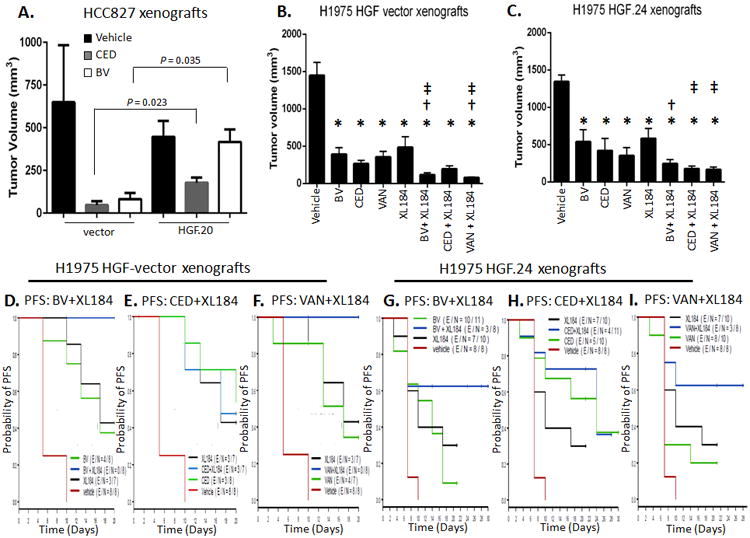
Figure 3. Ectopic HGF overexpression reduces sensitivity of NSCLC xenografts to VEGF/R inhibitors and dual VEGFR2/c-MET blockade prolongs PFS of NSCLC murine models.

A. Mean tumor volume differences (± SEM) following BV and CED 28-day treatment in HCC827-vector and -HGF.20 xenografts (at 28 day point: vector xenografts n=3-4/group; HGF.20 xenografts: n=5/group). P is from Mann-Whitney test. B, C. Tumor growth inhibition following 17 days of treatment with BV, CED, VAN, or XL184 alone or in combination in (B) H1975-vector (n=4-7/group) and (C) -HGF.24 xenografts (n=7-10/group). Data graphed as mean tumor volume at day 17 of treatment ± SEM. * P < 0.05 in the indicated treatment group vs. vehicle; † P ≤ 0.05 in BV + XL184 vs. BV and in VAN + XL184 vs. VAN in vectors, and in BV + XL184 vs. BV in HGF.24 xenografts; ‡ P < 0.05 in BV + XL184 vs. XL184, CED + XL184 vs. XL184 and VAN + XL184 vs. XL184. P values are from Mann-Whitney test. D-I. Kaplan-Meier curves show probability of PFS (time to tumor doubling) of mice bearing H1975 vector control tumors (D, E and F) or H1975-HGF.24 overexpressor tumors (G-I) treated with vehicle, BV, CED, VAN, and cabozantinib (XL184) or combination treatments. H1975 vector xenografts: overall P < 0.0001; BV + XL184 vs. BV, P = 0.015 (D); BV + XL184 vs. XL184, P 0.024 (D); CED + XL184 vs. CED, P = 0.73 (E); CED + XL184 vs. XL184, P = 0.95 (E); VAN + XL184 vs. VAN, P = 0.017 (F); VAN + XL184 vs. XL184, P = 0.033 (F). H1975 HGF.24 xenografts: overall P = 0.004; BV + XL184 vs. BV, P = 0.062 (G); BV + XL184 vs. XL184, P = 0.23 (G); CED + XL184 vs. CED P = 0.64 (H); CED + XL184 vs. XL184 P = 0.074 (H); VAN + XL184 vs. VAN P = 0.064 (I); VAN + XL184 vs. XL184, P = 0.19 (I). The P values are from log-rank test.
