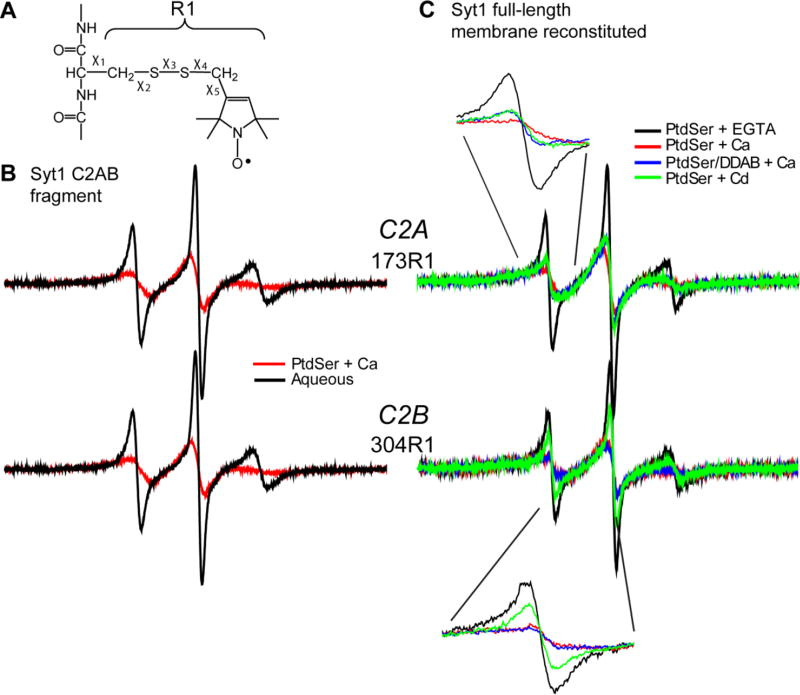
Figure 10.
EPR spectra reveal membrane contact and insertion of C2A and C2B. (A) The spin labeled side chain R1 is attached to cysteines using a sulfhydryl specific MTS label. (B) EPR spectra for the Syt1 C2AB fragment with R1 at position 173 in C2A or position 304 in C2B in solution (black traces) or in the presence of Ca2+ and PtdSer containing vesicles (red traces), (PC:PS=85:15). (C) EPR spectra from R1 at sites 173 and 304 in full-length Syt1 reconstituted into PtdSer in the absence of Ca2+ (black trace), in the presence of 1 mM Ca2+ (red trace), in the presence of 1 mM Cd2+ (green trace) (PC:PS=85:15) or in the presence of 1 mM Ca2+ when reconstituted into charge neutralized membranes of PtdSer and DDAB (blue trace) (PC:PS:DDAB=70:15:15). Shown in the insets are expansions of the low-field resonance.

