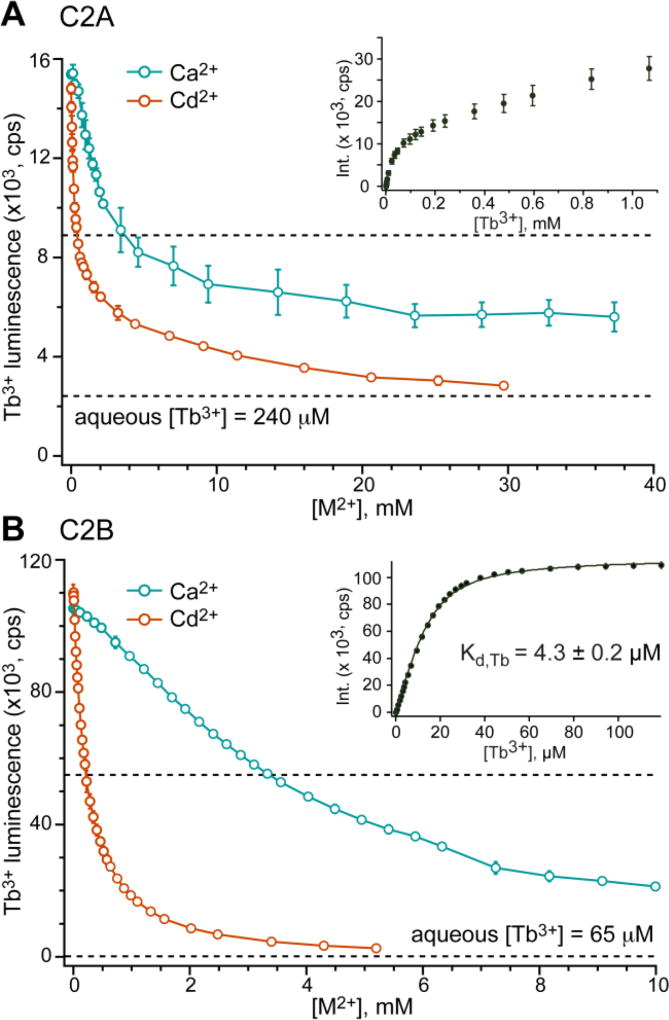
Figure 3.
C2A and C2B domains of Syt1 bind Cd2+ with higher affinity than Ca2+. (A) Displacement of bound Tb3+ from C2A by Ca2+ and Cd2+. C2A and Tb3+ concentrations are 15 and 240 µM, respectively. Inset: C2A–Tb3+ binding curve that has non-saturatable behavior due to comparable contributions of FRET and luminescence of free Tb3+ to the observed signal. (B) Displacement of bound Tb3+ from C2B by Ca2+ and Cd2+. C2B and Tb3+ concentrations are 15 and 65 µM, respectively. Inset: C2B–Tb3+ binding curve that shows saturatable behavior and produces Kd,Tb of 4.3±0.2 µM when fitted with a single-site binding model.

