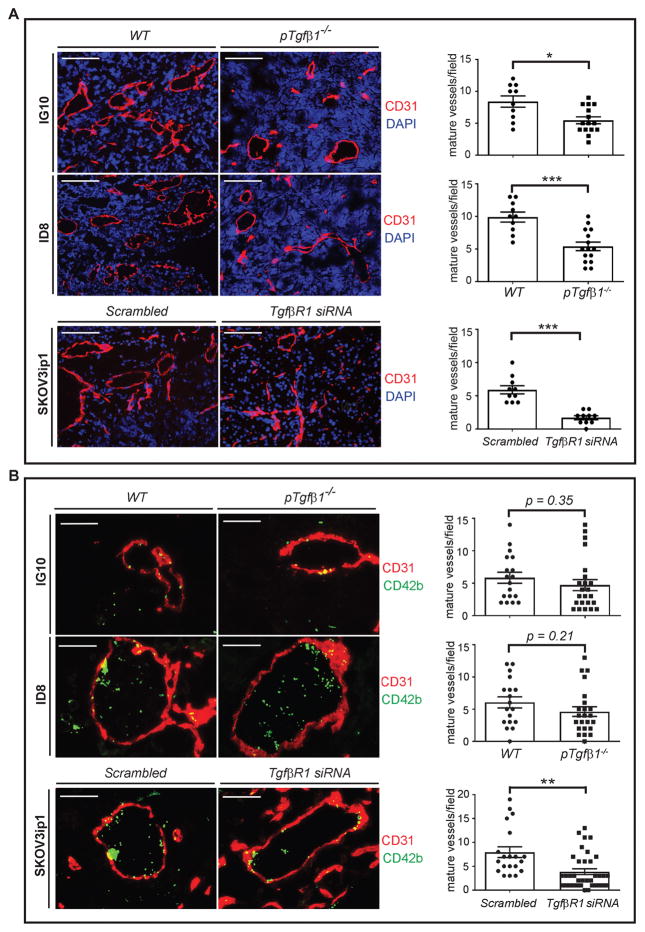
Figure 4.
Effect of platelet’s Tgfβ1 and ovarian cancer cell’s TgfβR1 on neoangiogenesis and platelet extravasation. Sections of IG10, ID8, and SKOV3ip-induced tumor nodules were stained with DAPI (nuclei of cancer cells), CD31 (endothelial cells) and CD42b (platelets) and analyzed by immunofluorescence microscopy. (A) The left side panel shows representative of micrographs from sections of tumor nodules. Blood vessels were detected by lumens encircled with CD31+ cells. The right side panel shows quantification of blood vessel density in each group of mice (5 mice/group, at least 3 tumor nodules per mouse, 1 section per nodule, and 2 or more HPF per section). Scale bars are 200 μm. (B) The left side panel shows representative micrographs of sections of tumor nodules. Extravasated platelets were detected by intratumor and extravascular CD42b+ cells. The right side panel shows quantification of extravasated platelets in each group of mice (5 mice/group and at least 3 tumor nodules per mouse, 2 random sections per nodule and 2 or more HPF per section). Scale bars are 100 μm. Student’s t-test is carried out for statistical analysis and significance levels indicated are as follows: p < 0.05 for *, p < 0.001 for ***. Averaged data are presented as the mean ± SEM.

