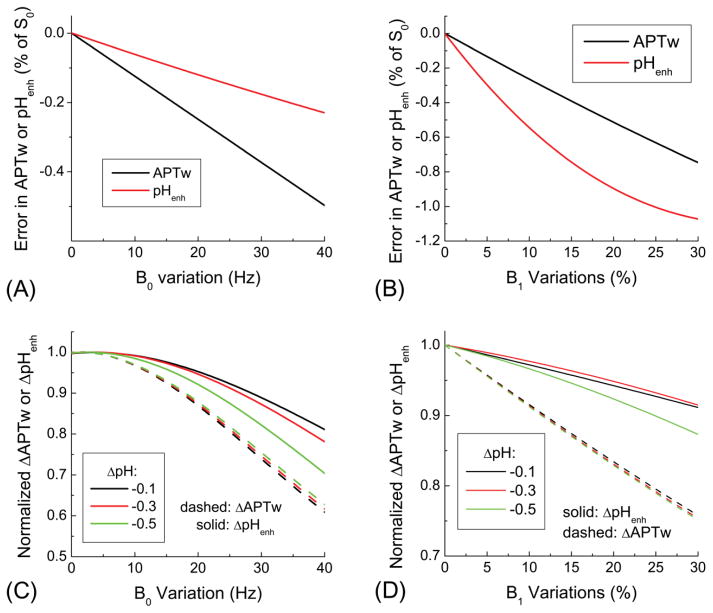
Fig. 2. Effect of B0 and B1 variations on pHenh and APTw signals.
The absolute error induced by B0 and B1 variations was determined for baseline conditions, while the normalized change was determined as a results of tissue acidosis. The baseline signal drift is less (more) sensitive to B0 (B1) for pHenh (A–B). In the presence of B0 and B1 variations, changes of APTw and pHenh signals due to tissue acidosis reduce, and the normalized change is smaller for pHenh than APTw (C–D).

