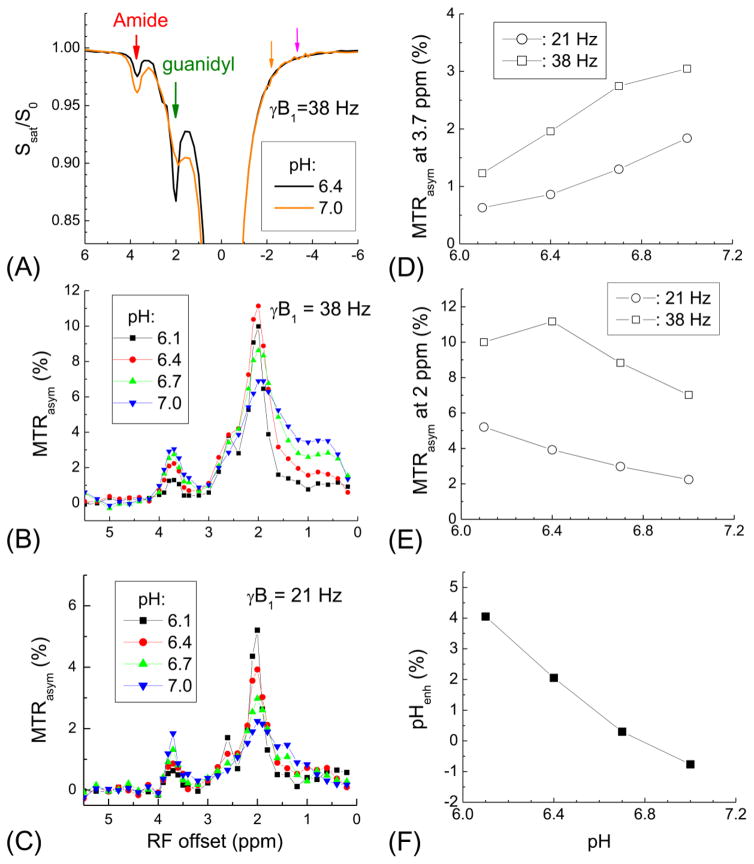
Fig. 4. pH sensitivity of amide and guanidyl CEST contrast: protamine phantom experiments.
(A) Z-spectra of protamine phantoms with pH of 6.4 and 7.0 were measured with γB1 = 38 Hz. The CEST signal from amide (red arrow) and guanidyl (green arrow) protons has opposite changes between two pH phantoms. These two CEST signals contain different contribution from the DWS, as shown by the pink and orange arrows at the opposite side of the water frequency. MTRasym was measured with γB1 = 38 Hz (B) and 21 Hz (C) for protamine phantoms at four different pH values, showing peaks at 3.7 ppm for the amide and 2 ppm for the guanidyl-CEST signals. Peak magnitude of MTRasym for amide-CEST at 3.7 ppm (D) and guanidyl-CEST at 2 ppm (E) show different pH- and power-dependences. (F) pHenh obtained from 21 Hz guanidyl and 38 Hz amide peaks enhances the contrast among these phantoms.

