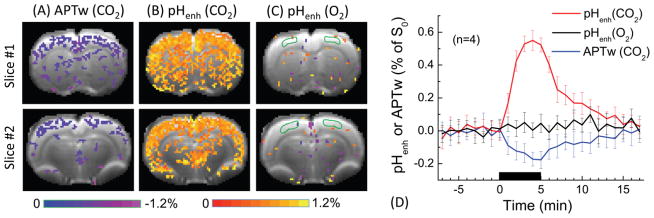
Fig. 6. In vivo APTw vs. pHenh results of hypercapnia and hyperoxia challenge.
10% CO2 gas was used to induce tissue acidosis and 70% O2 gas was used as a control experiment. Percent change maps of (A) APTw and (B) pHenh induced by 10% CO2 challenge, and (C) pHenh during 70% O2 challenge were overlaid on EPI images. (D) Time courses were obtained from the cortical ROI (delineated in C by green countours). Error bars: SD (n = 4), the black horizontal bar, time of gas challenge. During the acidosis-inducing CO2 challenge, APTw signal decreases slightly, whereas pHenh shows a much larger signal increase. In a control experiment, pHenh shows a minimal response during O2 challenge, which induces blood flow and volume changes without acidosis.

