
Figure 1.
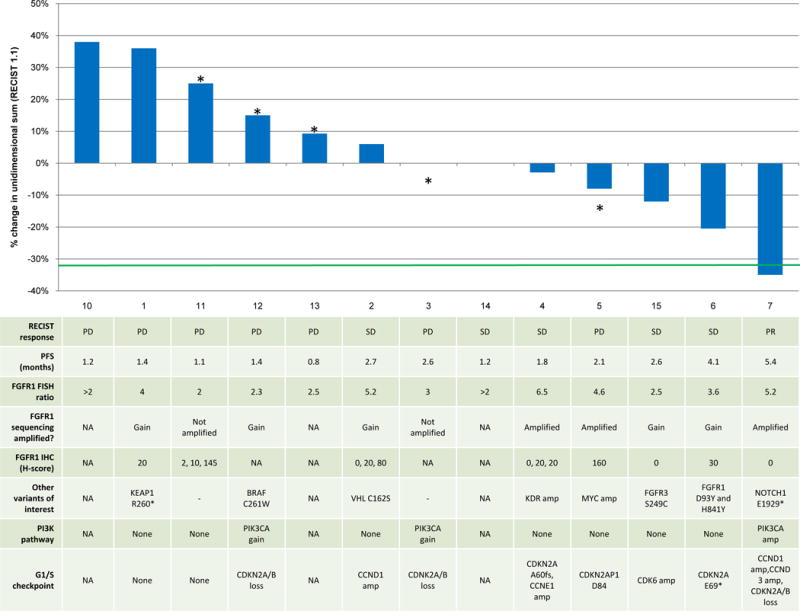
Waterfall plot of best response with molecular data shown in the table below for each corresponding patient. Data include FGFR1 amplification by FISH, FGFR1 immunohistochemistry, and somatic genomic alterations. *denotes disease progression.