
Figure 2.
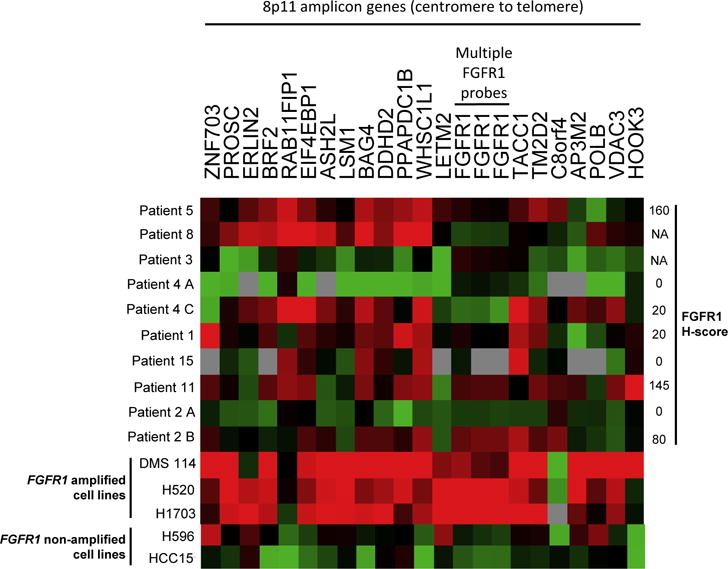
Heatmap for mRNA expression of select genes located on the 8p11 amplicon, arranged from centromere (left) to telomere (right). Red coloration denotes high expression and green denotes low expression for a given tumor sample. Grey denotes no detection of gene expression. H-score for FGFR1 protein expression is indicated on the right where available. DMS114, H520, and H1703 NSCLC cell lines were included as positive controls (FGFR1 amplified); H596 and HCC15 NSCLC cell lines were included as negative controls (FGFR1 non-amplified).