
Figure 1.
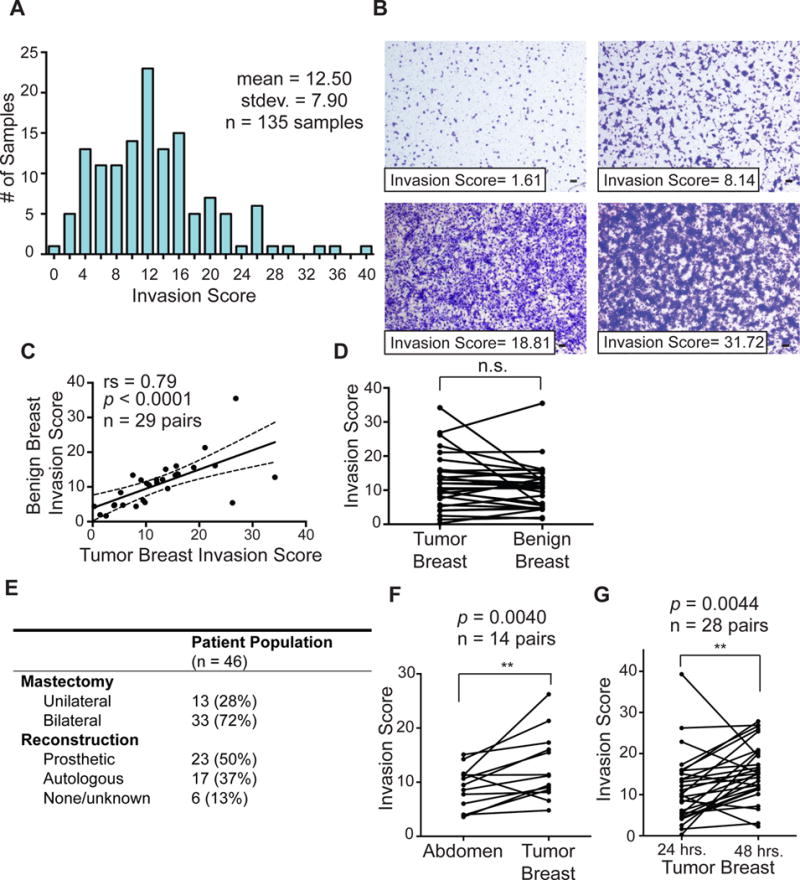
Classification of PSF according to invasion score identifies patients with high and low score PSF. A) Graph distribution of PSF samples according to calculated invasion score. Histogram of all breast and abdomen PSF samples collected 24 and 48 hours post-mastectomy (mean = 12.503; standard deviation = 7.899; n = 76 samples). B) Representative images of invasion assay of PSF with the indicated invasion score, scale bar = 100 μm. C, D) Comparison of the invasion scores of PSF from the benign and diseased-breasts bilateral mastectomy patients. Invasion scores were treated as a continuous variable, Wilcoxon matched-pairs signed rank test and linear regression was performed. E) Table of surgery characteristic in the patient population. F) Comparison of the invasion score of individual autologous reconstruction patients from the diseased-breast and abdomen-derived PSF. Invasion scores were treated as a continuous variable, Wilcoxon matched-pairs signed rank test and linear regression was performed. G) as in F but between the same breast from the same patient at 24 and 48 hours after surgery.