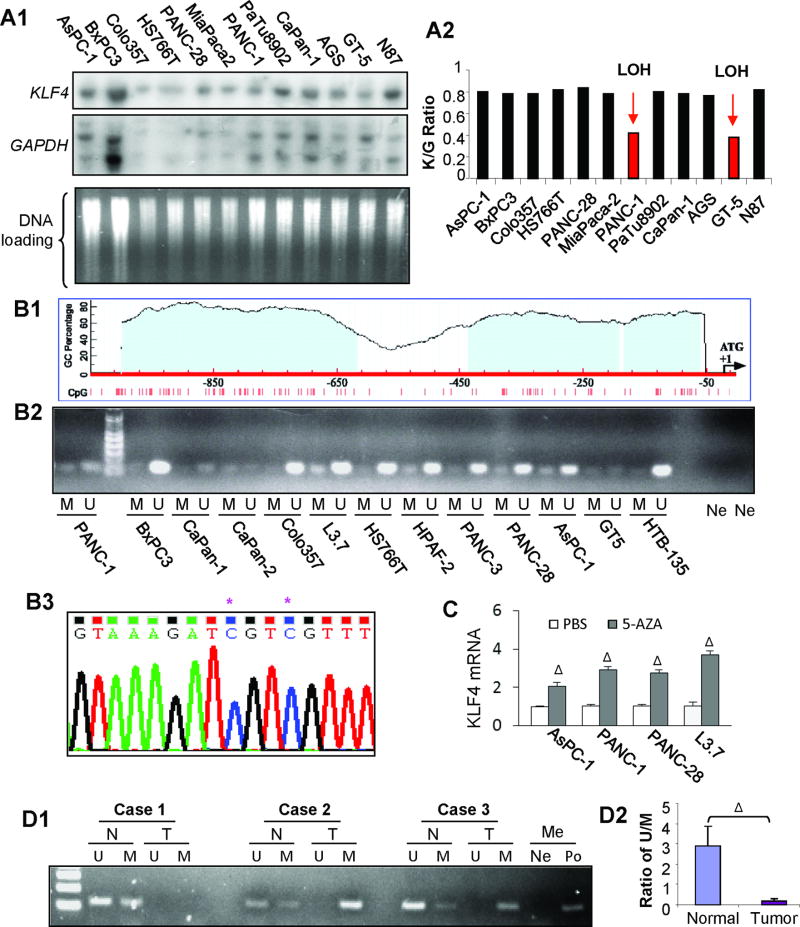
Figure 2.
Genetic and epigenetic alterations of KLF4 in pancreatic cancer. (A) Southern blot analysis of KLF4 gene status in pancreatic cancer cell lines and previously examined gastric cancer cell lines were included for controls. Representative blot images with related probes (panel A1) and the Ratio of KLF4/GAPDH signal intensity for normalization and comparison (panel A2). (B) Diagram of CpG sites and CpG islands in the promoter region of KLF4 gene (panel B1). Methylation-specific PCR analysis of DNA methylation using primers specific for the unmethylated (U) or methylated (M) KLF4 promoter region using the genomic DNA extracted from pancreatic and gastric cancer cell lines (panel B2). Note: Ne, H20 was used as a negative control for the primers of U and M, respectively. Bisulfite–DNA sequence analysis confirmed the existence of KLF4 promoter methylation in L3.7 cells (panel B3). Note: * indicates methylated C in CpG sites. (C) Poorly differentiated pancreatic cancer cells were cultured in the presence of AZA (1 µmol/L) or not (PBS) for 3 days. Total RNA was extracted and used for RT-qPCR analysis of KLF4 mRNA expression. (D) Methylation-specific PCR analysis of genomic DNA extracted from laser-capture microdissection samples of paired pancreatic normal (N) and tumor (T) tissues (panel D1), with an average ratio of U/M shown in Panel D2Note: H20 (Ne) and methylation-positive DNA sample (Po) were used with methylation specific primers, respectively; ΔP < .01 vs control. (See also supplementary Figures 1&2).

