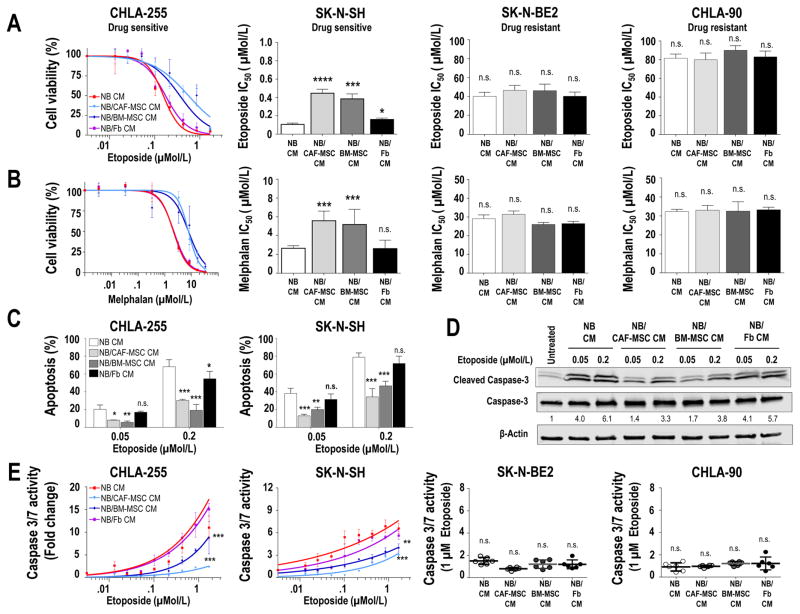
Figure 4. CAF-MSC protect tumor cells from drug-induced apoptosis.
A–B: Indicated NB cells were cultured in CM from NB, NB/CAF-MSC, NB/BM-MSC or NB/Fb co-cultures, treated with etoposide (A) or melphalan (B) at the indicated concentrations for 48 hours and examined for cell viability. The graph on the left represents the dose-response curve with the mean (±SD) percentage of viable cells from control (no drug) in triplicate samples and are representative of one of three independent experiments showing similar results. The histograms on the right represent the mean (±SD) IC50 values calculated from the dose-response curves; C: NB cells were cultured as described in A, treated at the indicated concentrations of etoposide, and examined after 48 hours for apoptosis by flow cytometry. The histograms represent the mean (±SD) percentage of Annexin V+/PI+ and Annexin V+/PI− cells from triplicate samples and results are representative of one of two independent experiments showing similar results; D: CHLA-255 cells were cultured and treated as in C and examined after 48 hours for cleavage of caspase-3 by western blot analysis. β-actin was used as a loading control; E: Indicated NB cells were cultured and treated as described in A and examined for caspase 3/7 activity after 48 hours. The data represent the mean fold change (±SD) of caspase 3/7 activity from triplicate samples and are representative of one of two independent experiments showing similar results. The scatter dot plot graphics on the right represent the mean fold change (±SD) of caspase 3/7 activity of NB treated with etoposide at a concentration of 1 μM and are representative of one of two experiments showing similar results. *p<0.05; **p< 0.01; ***p<0.001; ****p< 0.0001; n.s. = non-significant.

