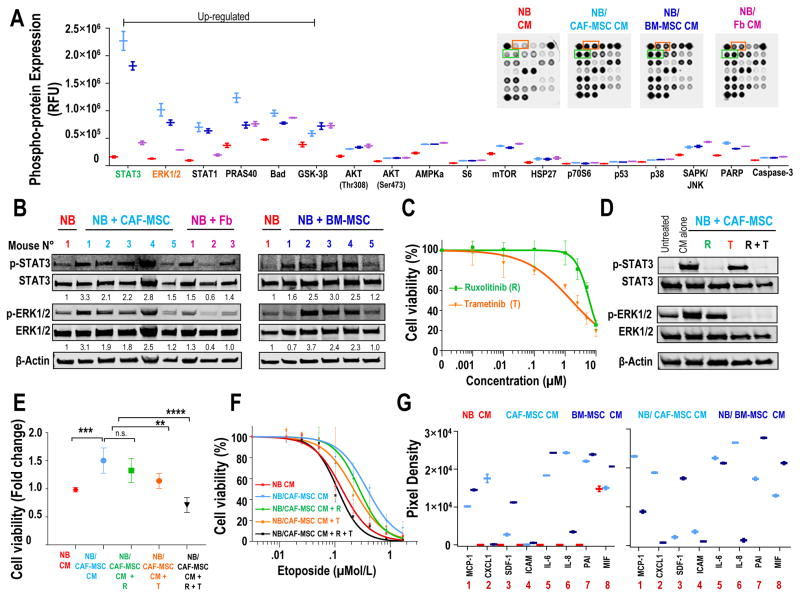
Figure 5. The pro-tumorigenic activity of CAF-MSC is STAT3 and ERK1/2-dependent.
A: CHLA-255 cells were exposed to CM from NB, NB/CAF-MSC, NB/BM-MSC or NB/Fb co-cultures for 30 minutes and analyzed for the indicated phosphorylated proteins using the PathScan Intracellular Signaling Array. The graphic represents the mean (±SD) relative fluorescence units (RFU) for each phosphorylated protein. Insert: Picture of typical dot blots; B: Western blot analysis of the expression of p-STAT3 and p-ERK1/2 in lysates of tumors obtained from the subcutaneous injection of mice with CHLA-255-FLuc cells alone or mixed with CAF-MSC, Fb or BM-MSC as shown in Fig. 2A–B. β-Actin was used as a loading control; C: CHLA-255 cells were treated with increased concentrations of ruxolitinib (R) or trametinib (T) and examined for cell viability after 48 hours. The data represent the mean (±SD) percentage of viable cells determined by the luminescence activity from triplicate samples and results are representative of one of two independent experiments showing similar results; D: Western blot analysis of the expression of p-STAT3, STAT3, p-ERK1/2 and ERK1/2 in CHLA-255 cells exposed to NB/CAF-MSC CM and treated with ruxolitinib (2.5 μM), trametinib (0.01 μM) or combination of both inhibitors for 30 minutes. β-Actin was used as a loading control. Data are representative of one of two independent experiments showing similar results; E: CHLA-255 cells were exposed to NB CM or NB/CAF-MSC CM, treated as in D and examined for viability after 48 hours. The data represent the mean (±SD) fold change of cells viability determined by the luminescence activity from triplicate samples and results are representative of one of two independent experiments; F: CHLA-255 cells were exposed to NB CM or NB/CAF-MSC CM, treated with the indicated concentrations of etoposide in the presence of ruxolitinib (R), trametinib (T) or their combination (R+T) and examined for viability after 48 hours. The data represent the mean (±SD) percentage of viable cells determined by luminescence activity from triplicate samples and are representative of one of two independent experiments showing similar results. G: CHLA-255, CAF-MSC and BM-MSC cells were cultured alone or together for 48 hours. The levels of soluble factors present in the CM were analyzed by a Cytokine Array Panel and quantified by scanning as described in Materials and Methods. The graphs represent the mean (±SD) pixel density of each duplicate spot obtained with CM of cells cultured alone (left) or together (right). **p< 0.01; ***p<0.001; ****p< 0.0001; n.s. = non-significant.

