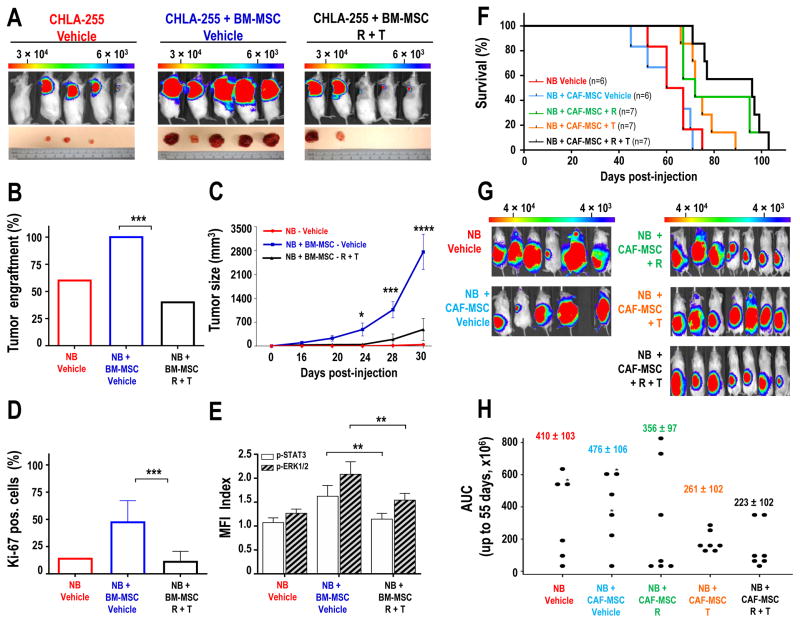
Figure 6. Inhibition of STAT3 and ERK1/2 suppresses tumor engraftment and growth and increases survival in NB xenograft models.
A: Representative bioluminescence images of NSG mice at day 30 after subcutaneous injection with CHLA-255-FLuc cells alone (n=5) or mixed with BM-MSC (ratio 4:1) and treated with vehicle (n=5) or ruxolitinib (R, 90 mg/kg/day) and trametinib (T, 0.1 mg/kg/day) (n=5). Lower panel: pictures of tumors harvested at day 32; B: Percentage of engrafted tumors in each group; C: Mean (±SD) tumor size over time for all mice in each group; D: Quantification of Ki-67-positive cells (±SEM) from an average of 10 fields (×20) examined for each section in each group. The data represent the mean (±SD) percent of Ki-67 positive cells from 10 fields (×20) examined for each tumor section; E: Flow cytometry analysis for p-STAT3 and p-ERK1/2 in GD2-positive NB cells harvested from tumors shown in A. The data represent the mean (±SD) MFI index from all developed tumors in each group; F: Kaplan-Meier survival curves of mice injected in the sub-renal capsule with CHLA-255-FLuc cells alone or with CAF-MSC (ratio 4:1). One week after implantation, mice were treated with vehicle or ruxolitinib (R, 90 mg/kg/day), or trametinib (T, 0.1 mg/kg/day), or their combination (R+T). The data are the results of 2 independent experiments with a total of 33 mice that developed tumors. Mice that didn’t developed tumors were excluded from the analysis; G: Representative bioluminescence images at day 50 of NSG mice in each group H: Dot plot of area under curve (AUC) of all bioluminescence signal intensity (p/s = photons per second) up to day 55 (n=33 mice) in each group. The stars indicate which mouse had a censored AUC as they died before day 55. * p<0.05; **p< 0.01; ***p<0.001.

