
Figure 3.
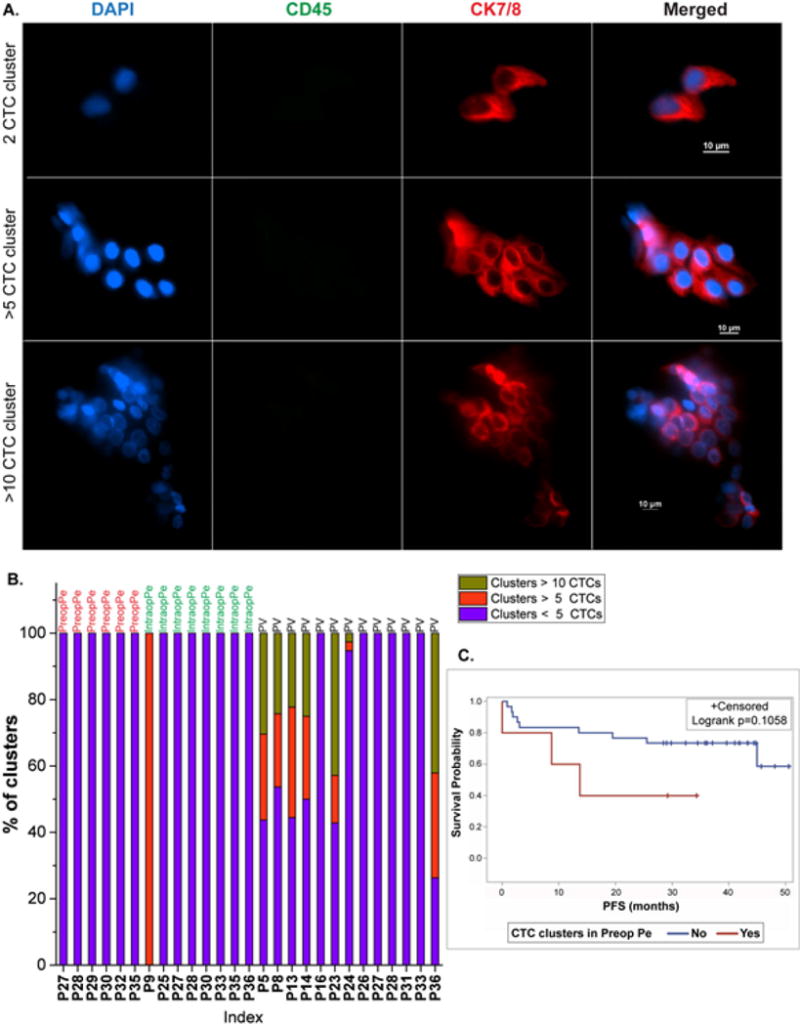
CTC clusters in lung cancer patients. (A). Immunofluorescent staining images of captured CTC clusters showing a 2 CTC cluster, >5 CTC cluster, and >10 CTC cluster, (B). Distribution of sizes of the clusters obtained from cluster positive specimens, (C). Survival curves showing comparison of progression free survival (PFS) in patients with clusters (red) and without clusters (blue) in the Pre-op Pe blood.