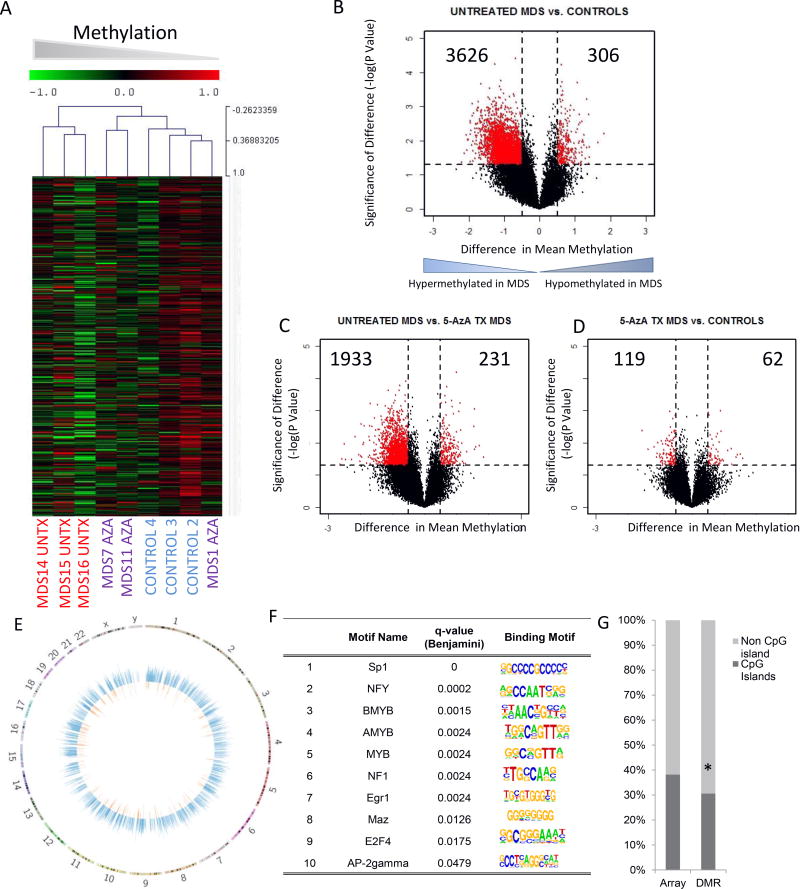
Fig 1. Widespread Epigenetic alterations are seen in MDS stroma.
Unsupervised clustering of primary MDS stromal cells from untreated patients (MDS UnTx), MDS stromal cells from patients treated with 5-Azacytidine (MDS Aza) and healthy controls shows that MDS UnTx stroma has a distinct DNA methylation profile (Hierarchical clustering, Wards) (A). Volcano plot shows that most of differentially methylated genes in stroma from untreated patients are hyper-methylated (B). Comparison of 5-Aza treated stroma with Untx MDS stroma and healthy controls shows that 5-Aza treated samples do not have increased numbers of hypermethylated loci (C, D). Circos plots show that aberrant hypermethylation (blue) occurs throughout the genome and is more frequent than aberrant hypomethylation (orange). (E). Transcription factor binding sites that are enriched at differentially methylated regions (DMRs) are shown with motifs (F). DMRs in UnTx MDS stroma were predominantly present in non CpG island locations (87.9%) and were significantly different from the distribution of HpaII loci in the whole HELP array (61.8%) (Test of Proportions, P Value<0.001) (G).

