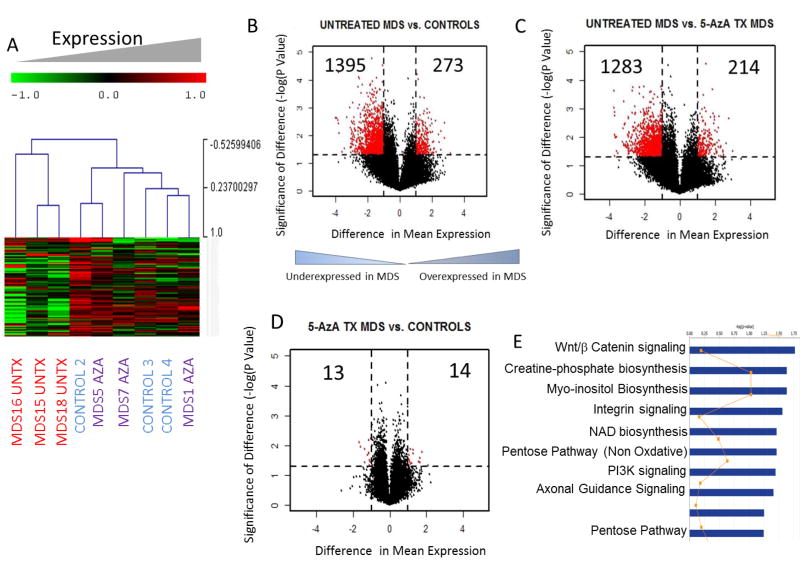
Fig 2. Widespread transcriptomic alterations are seen in MDS stroma.
Unsupervised hierarchical clustering of 3 primary untreated MDS stromal cells (MDS UnTx), MDS stromal cells form patients treated with 5-Azacytidine (MDS Aza) and healthy controls shows that MDS stroma has distinct gene expression profiles (A). Volcano plot shows that the majority of differentially expressed genes in untreated MDS stroma are underexpressed (B). Comparison of 5-Aza treated with Untx MDS and healthy controls shows that 5-Aza treated samples are similar to controls and do not have increased numbers of aberrantly expressed genes (C, D). Ingenuity functional pathway analysis of signaling pathways that are differentially expressed and differentially methylated between Untx MDS and control samples or UnTx and Aza treated samples (E).

