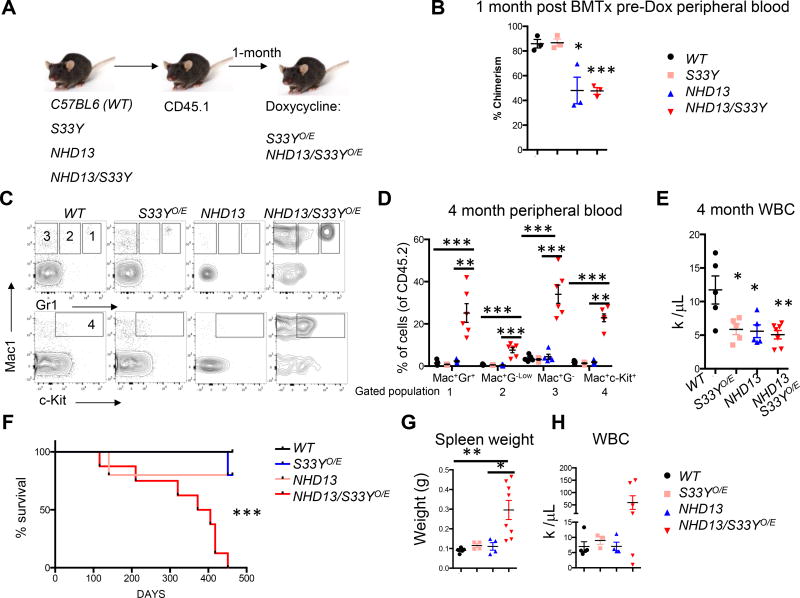
Figure 5. Constitutive activation of β-catenin in an MDS model accelerates myeloid disease progression.
(A) Experimental scheme demonstrating donor bone marrow C57BL6; WT, S33YO/E, NHD13 and NHD13/S33YO/E mice. These cells were transplanted, allowed to engraft into congenic CD45.1 recipients for 1 month and then fed doxycycline feed (B) CD45.1 recipient mice were assessed for donor cell chimerism in the peripheral blood before doxycycline (Dox) addition (n=3 per group, TTest, *P Value<0.05, **P Value<0.01, ***P Value<0.001). (C) Representative Mac1, Gr1, and c-Kit flow cytometric staining of peripheral blood from 4 months post engraftment. Gate numbering represents Mac+Gr1+ (1), Mac+Gr1Low (2), Mac+Gr1− (3), Mac+c-Kit+ (4). (D) Quantification of flow cytometric analysis and gating as described in (C), (C57BL6; WT n=5, S33YO/E; n=5, NHD13 n=5, and NHD13/S33YO/E n=6, TTest, *P Value<0.05, **P Value<0.01, ***P Value<0.001). (E) White blood cell (WBC) counts in peripheral blood 4 months post-transplant, (C57BL6; WT n=5, S33YO/E; n=5, NHD13 n=5, and NHD13/S33YO/E n=7, TTest, *P Value<0.05, **P Value<0.01, ***P Value<0.001) (F) Kaplan-Meier curve of bone marrow transplantation described in (A), C57BL6; WT n=5, S33YO/E; n=5, NHD13 n=5, and NHD13/S33YO/E n=8, TTest, *P Value<0.05, **P Value<0.01, ***P Value<0.001). (G) Spleen weights from moribund mice or mice sacrificed at 463 day endpoint analysis, C57BL6; WT n=5, S33YO/E; n=4, NHD13 n=4, and NHD13/S33YO/E n=8, TTest, *P Value<0.05, **P Value<0.01, ***P Value<0.001) (H) WBC from moribund mice or mice sacrificed at 463 day endpoint analysis, C57BL6; WT n=5, S33YO/E; n=3, NHD13 n=4, and NHD13/S33YO/E n=6, TTest, *P Value<0.05, **P Value<0.01, ***P Value<0.001). All statistical analyses were compared to control mice or between NHD13 and NHD13/S33YO/E.

