Figure 4.
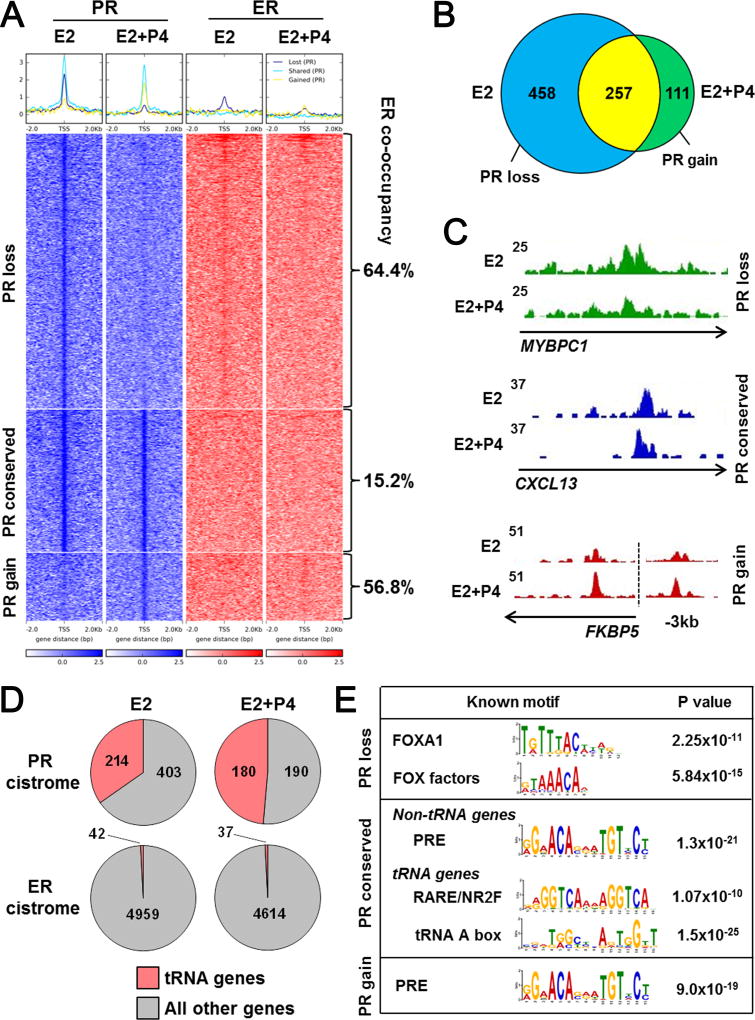
The PR cistrome is distributed between ER co-occupied binding sites and RNA Pol III-regulated genes. ChIP-seq was performed for PR in triplicate UCD4 tumors grown in mice supplemented with E2 or E2+P4. A, Heat map depicts intensity of PR binding events at genomic loci with loss (PR loss), conservation (PR conserved), or gain (PR gain) in tumors treated with E2+P4 compared to E2 alone (blue). ER binding events at the same loci are depicted on the right (red). Percent of ER co-occupancy with PR is indicated for each group. The heat map is shown in a horizontal window of ± 2 kb. B, Venn diagram depicts overlap between PR binding events in E2 and E2+P4 treated tumors. C, Representative PR peaks that were conserved, lost, or gained with E2+P4 compared to E2 alone. D, Pie charts depict number of total PR or ER binding sites localized near tRNA vs. non-tRNA genes in E2 and E2+P4 treated tumors. E, Enriched sequence motifs in the PR loss, conserved, and gain groups.

