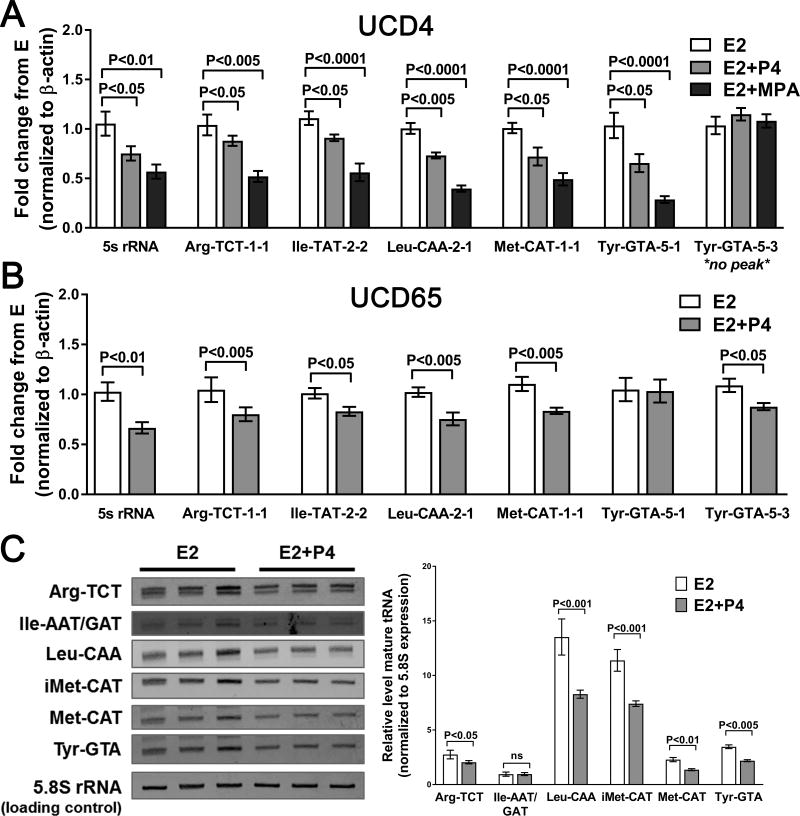
Figure 7.
P4 decreases pre- and mature tRNA levels in ER+PR+ PDX breast tumors. A and B, qPCR analysis of primary tRNA levels in UCD4 (A) and UCD65 (B) tumors grown in mice supplemented with E2, E2+P4, or E2+MPA (UCD4 only). Three independent biological replicates were used for analysis. Bars represent mean ± SEM. Significance was determined using one-way ANOVA followed by Tukey post-hoc multiple comparison tests (A) or Students t-test (B). C, Northern blot analysis of mature tRNA families (i.e. all Arg-TAT species) in UCD 4 tumors grown in mice supplemented with E2 or E2+P4. Three independent biological replicates were used. Quantified was normalized to RNA Pol I-regulated 5.8S rRNA. Quantification is graphed on the right as mean ± SEM. Significance was determined using a Student’s t-test for each tRNA group.

