
Figure 4. The genetic architecture of parental behaviour.
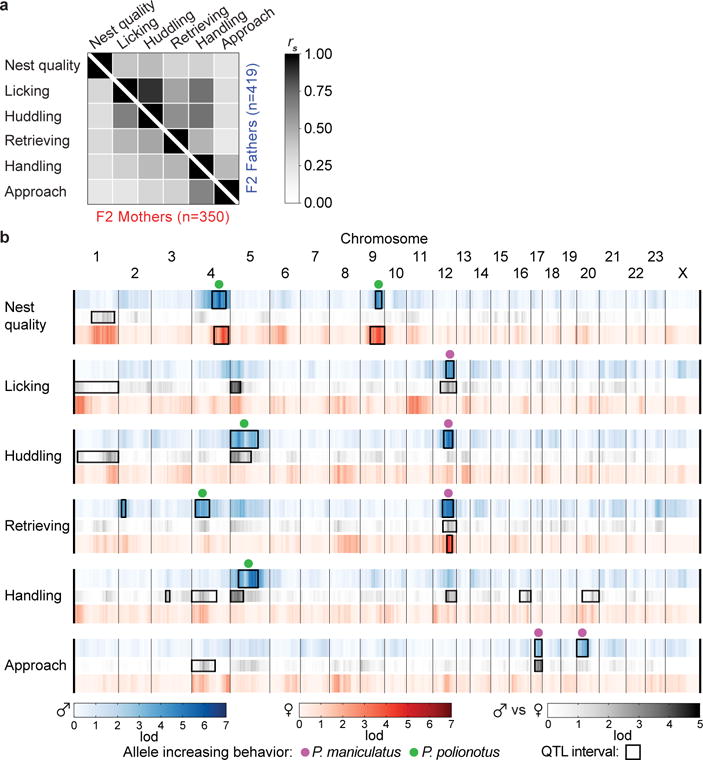
a) Correlation matrix of parental behaviours in F2 hybrids. b) The linkage (lod score) of each behaviour to each marker in each sex and the sex-by-genotype interaction (gray). Boxes delineate the Bayes 0.95 credible interval of QTL of genome-wide significance (α=0.05). Dots denote the allele at the peak of the QTL that correlates with a higher value for that behaviour (for handling and approach, a decrease in latency to perform behaviour). Heterozygotes at QTLs on chromosomes 2 and 12 (females only) retrieve more pups (see Extended Data Fig. 4 and Supplementary Discussion).