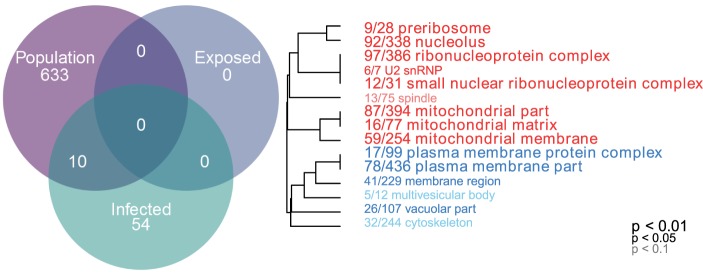
Figure 1.
Linear modeling reveals differences between populations and by infection status (all genes p < 0.1 after 10% FDR correction). Genes which are differentially expressed between Rob and Gos are enriched for mitochondrial respiration (cellular components, Mann–Whitney U-test, p < 0.01 after 10% FDR correction). GO categories in red are upregulated in Rob fish, while blue indicates downregulated, relative to Gos. Numbers indicate genes present in category/total genes in category. Text size indicates statistical significance of GO term enrichment among differentially-expressed genes. See Figure S1 in Supplementary Material for molecular function and biological processes.

